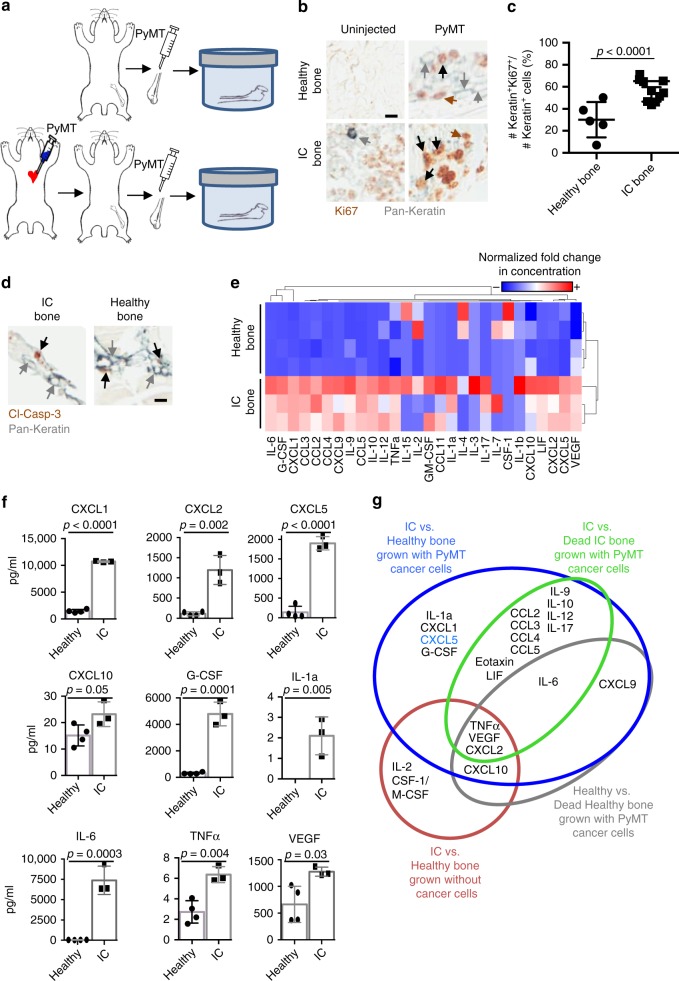
Fig. 2.
Cancer-primed bones promote cancer cell proliferation. a Experimental design of ex vivo bone culture of healthy (top) mouse bone explants and cancer-primed (bottom) bone explants after intracardiac (IC) injection of PyMT cancer cells prior to culture. b IHC co-staining for Pan-cytokeratin (gray) and Ki67 (brown) of uninjected or PyMT-injected bone cultures of healthy mouse bone or IC mouse bone co-cultured for 2 weeks. Gray arrows indicate Keratin+Ki67– cells, brown arrows indicate Ki67+ only cells, and black arrows indicate Keratin+Ki67+ cells (scale bar: 10 μm). c Comparison of percentage of Ki67+ cancer cells over total number of cancer cells of mouse bone between the healthy and the IC bone co-cultures after a 2-week culture period (p < 0.0001, Student’s t test). Each dot represents the percentage of Ki67+Keratin+ cancer cells detected in one section of the bone. Lines show the mean and standard deviation. d IHC co-staining for Pan-cytokeratin (gray) and cleaved-caspase 3 (apoptosis marker). Neither IC nor healthy bone co-cultures present a high number of dying cells positive for cleaved-caspase 3. Gray arrows indicate Keratin+Ki67– cells, and black arrows indicate Keratin+cleaved-caspase 3+ cells (scale bar: 10 μm). e Heatmap of quantified chemokines and cytokines demonstrating unique protein expression profiles in the media supernatant of healthy bone and IC bone co-cultures with PyMT cancer cells. Higher concentrations of chemokines are shown in red and lower concentrations are shown in blue. Values in the heatmap show normalized fold increase concentration for each soluble factor. f Quantification of cytokine and chemokine protein concentration in conditioned media from co-cultures grown for 2 weeks with healthy bone or IC bone in co-culture with PyMT cells. Cytokines and chemokines included: CXCL1 (p < 0.0001), CXCL2 (p = 0.002), CXCL5 (p < 0.0001), CXCL10 (p = 0.05), G-CSF (p = 0.0001), IL-1a (p = 0.005), IL-6 (p = 0.0003), TNFα (p = 0.004), and VEGF (p = 0.03). All p values were generated by Student’s t test. g Venn diagram illustrating the cytokines and chemokines differentially expressed in the media supernatant of dead, healthy, and IC bone culture with or without cancer cells

