Fig. 4.
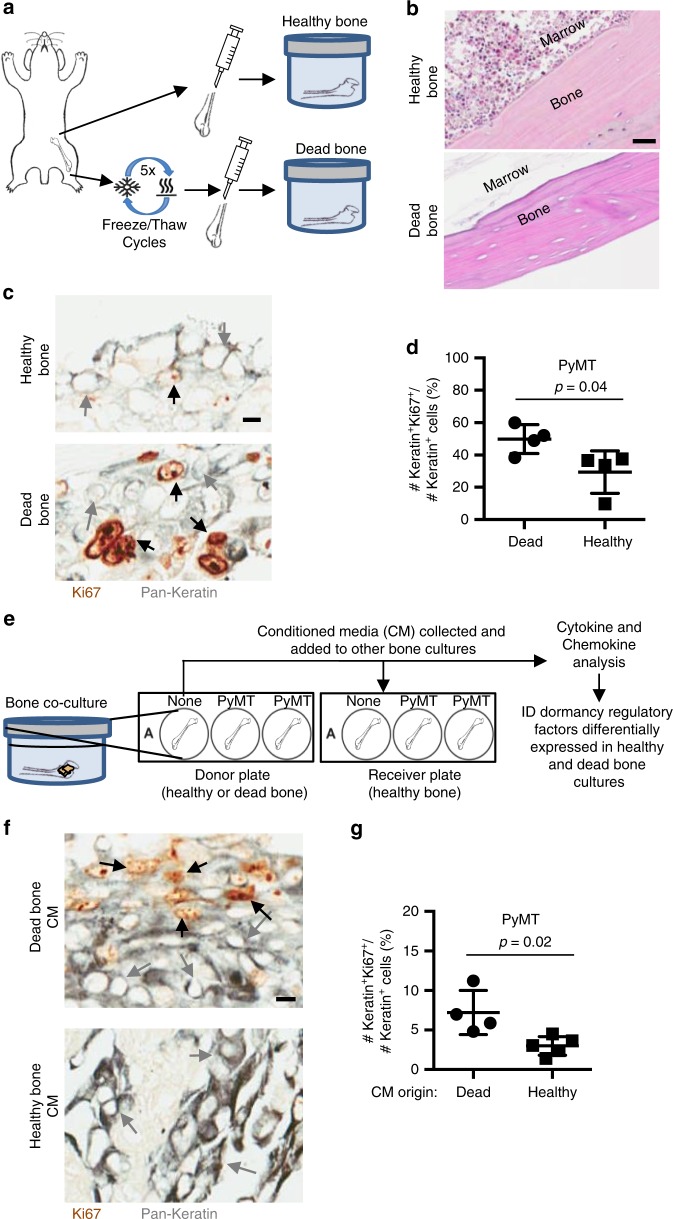
Healthy mouse bones inhibit cancer cell proliferation. a Experimental design of healthy (live) and dead bone co-cultures grown with breast mammary epithelial cancer cells. Dead bone was defined as healthy bone explants that underwent at least five freeze/thaw cycles prior to culture. b H&E staining of a healthy bone (top) and a dead bone (bottom) explant to show the devitalized bone lacking viable cells in bone and marrow (scale bar: 30 μm). c IHC co-staining for pan-cytokeratin (gray) and Ki67 (brown) in healthy (top) and dead bone (bottom) co-cultures after 3 weeks in culture. Gray arrows indicate Keratin+Ki67– cells, and black arrows indicate Keratin+Ki67+ cells (scale bar: 10 μm). d Comparison of percentage of Ki67+Keratin+ cancer cells over total number of Keratin+ cancer cells of mouse bone in healthy and dead bone co-cultures cultured with PyMT cells (p = 0.04). e Experimental design of co-cultures with conditioned media added to co-cultures of healthy bone and breast mammary epithelial cancer cells. Conditioned media was collected from previous cultures of healthy or dead bone co-cultures and either added to additional co-cultures in combination with fresh media for the new co-cultures or was sent for analysis. f IHC co-staining for pan-cytokeratin (gray) and Ki67 (brown) of a 2-week co-culture of healthy bone samples with cancer cells using conditioned media from (top) dead bone or (bottom) healthy bone. Gray arrows indicate Keratin+Ki67– cells, and black arrows indicate Keratin+Ki67+ cells (scale bar: 10 μm). g Comparison of percentage of Ki67+Keratin+ cancer cells over total number of Keratin+ cancer cells of mouse bone in healthy and dead conditioned media bone co-cultures with PyMT cells (p = 0.02). For all Keratin and Ki67 staining comparison, each dot represents the percentage of Ki67+Keratin+ cancer cells detected in one section of bone. Lines show the mean and standard deviation. All p values were calculated by Student’s t test

