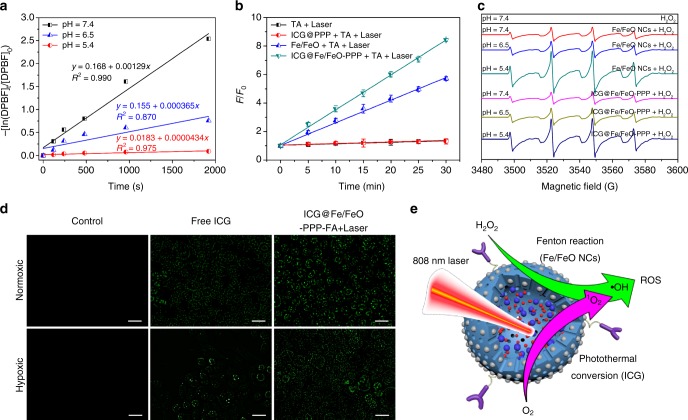
Fig. 3.
Evaluation of the ROS generation and the mechanism of ROS production. a Detection of 1O2 by UV-vis absorbance spectra for ICG@Fe/FeO–PPP nanocapsules with DPBF at pH value of 7.4, 6.5 and 5.4 phosphate buffer. b Fluorescence intensity of TAOH at 440 nm as a function of laser irradiation time for the ICG@Fe/FeO–PPP nanocapsules and different control treatments. F0 and F were the fluorescence intensities of the system without or with treatment, respectively. The error bars represent the standard deviations of three separate measurements. c ESR spectra of Fe/FeO NCs and ICG@Fe/FeO–PPP nanocapsules with DMPO as the spin trap in different pH values condition (7.4, 6.5 and 5.4). d 1O2 generation evaluated by DHR123 in KB cells treated with free ICG and ICG@Fe/FeO–PPP–FA nanocapsules under normoxic and hypoxic conditions (scale bars: 20 μm). e Synergism schematic of Fenton reaction of Fe/FeO NCs with photothermal conversion (ICG) in ICG@Fe/FeO–PPP–FA nanocapsules. (Error bars, mean ± SD, n = 6, ROS reactive oxygen species.)

