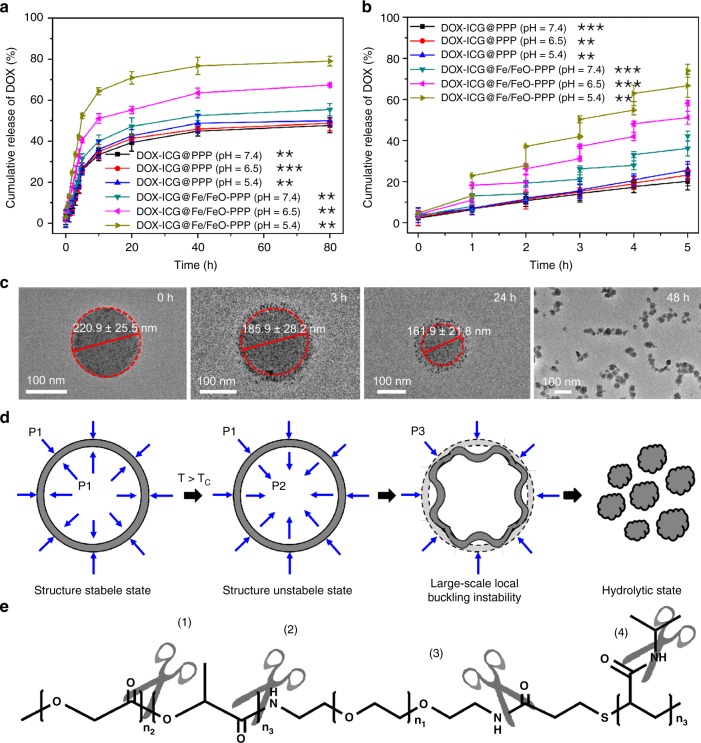
Fig. 4.
DOX delivery evaluation of DOX–ICG@Fe/FeO–PPP nanocapsules. a DOX release curves of DOX–ICG@PPP nanocapsules and DOX–ICG@Fe/FeO–PPP nanocapsules in different pH values (7.4, 6.5 and 5.4) at 37 °C. b DOX release curves of DOX–ICG@PPP nanocapsules (pH = 7.4, 6.5 and 5.4) and DOX–ICG@Fe/FeO–PPP nanocapsules (pH = 7.4, 6.5 and 5.4) with four laser on/off cycles under a laser irradiation (808 nm, 0.3 W cm−2) for 5 min. c TEM image of the shrinking process for DOX–ICG@Fe/FeO–PPP nanocapsules in 48 h after the irradiation of laser (808 nm, 0.3 W cm−2) for 5 min (pH = 6.5). d Schematic diagram of radial stress analysis of DOX–ICG@Fe/FeO–PPP nanocapsules in the shrinking process, and P1, P2 and P3 represent the radial stress for the nanocapsules in different stages. e Schematic diagram of the degradability for PPP at pH below 6.5. P values in a and b were calculated by Tukey’s post-hoc test (**P < 0.01, ***P < 0.001) by comparing other groups with the last group (DOX–ICG@Fe/FeO–PPP–FA, pH = 5.4). Error bars, mean ± SD (n = 6)

