Fig. 5.
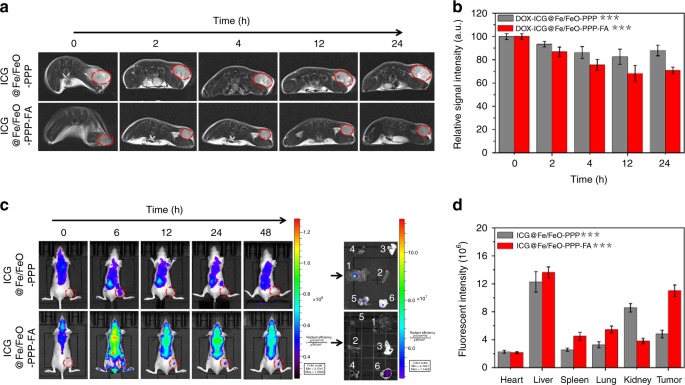
In vivo imaging. a Real-time MRI of KB tumor-bearing mice after intravenous injection of ICG@Fe/FeO–PPP nanocapsules and ICG@Fe/FeO–PPP–FA nanocapsules. b The relative MRI signal intensities changing at the tumor site after intravenous injection of ICG@Fe/FeO–PPP nanocapsules and ICG@Fe/FeO–PPP–FA nanocapsules, respectively. c Real-time fluorescence images of tumor-bearing mice after intravenous injection of ICG@Fe/FeO–PPP nanocapsules and ICG@Fe/FeO–PPP–FA nanocapsules. Ex vivo fluorescence images of liver (1), spleen (2), lung (3), heart (4), kidney (5) and tumor (6), which were obtained at 48 h post-injection. d The fluorescence intensities of the major organs after intravenous injection of ICG@Fe/FeO–PPP nanocapsules and ICG@Fe/FeO–PPP–FA nanocapsules, respectively. P values in b and d were calculated by Tukey’s post-hoc test (**P < 0.01, ***P < 0.001) by comparing ICG@Fe/FeO–PPP nanocapsules with ICG@Fe/FeO–PPP–FA nanocapsules. Error bars, mean ± SD (n = 5)

