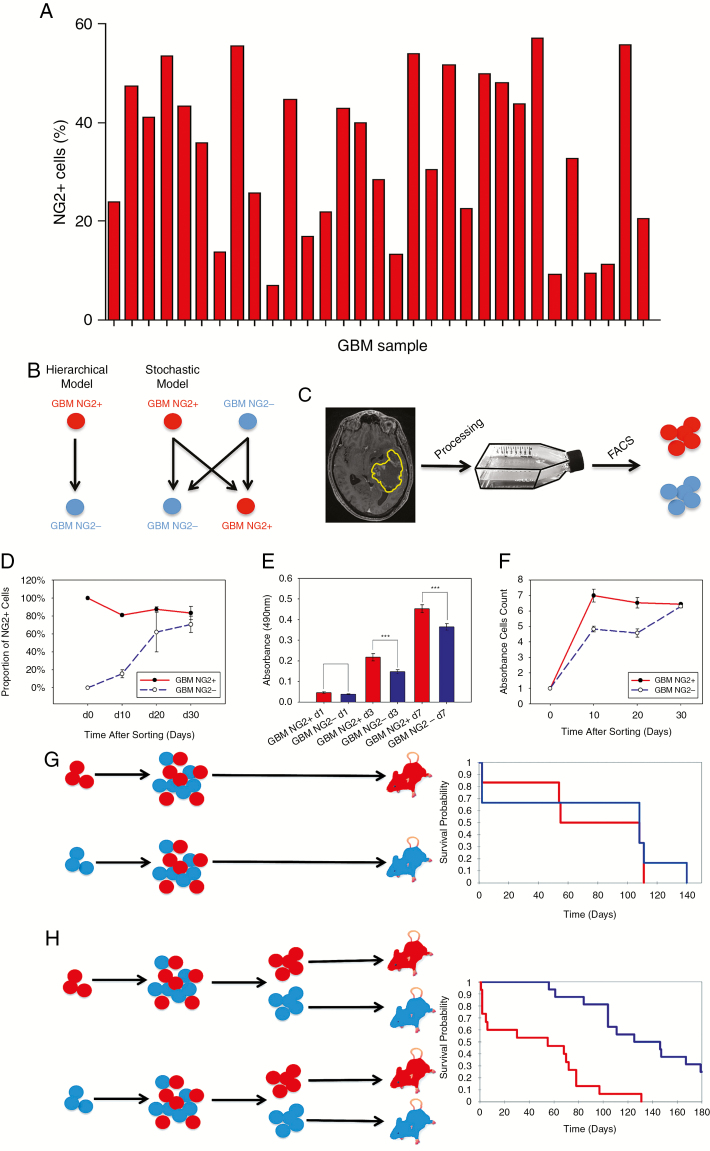
Fig. 1.
Expression of NG2 identifies populations that establish a phenotypic equilibrium. (A) Proportion of NG2+ cells (viable cell population) in 31 freshly derived tumor samples (flow cytometry). (B) Possible lineage relationships between GBM NG2+ and NG2− cells; a hierarchical model (left) where NG2− cells cannot give rise to NG2+ cells, or a non-hierarchical model (right). (C) We used patient-derived GBM cells, FAC-sorted into NG2+ and NG2− fractions. (D) Changes in the proportion of NG2+ cells over time in sorted GBM NG2+ and NG2− populations. (E) MTS assay of GBM NG2+ and NG2− cells at days 1, 3, and 7 post-sorting. (F) Diagram showing the growth of the GBM NG2+ and GBM NG2− cells at days 10, 20, and 30 after sorting. (G, H) Sorted GBM NG2+ and NG2− populations were cultured in vitro, before grafting to NOD-SCID mice. Kaplan–Meier analysis demonstrates no difference in survival (G). However, when these cells were re-sorted into NG2+ and NG2− populations prior to grafting, there is reduced survival in mice grafted with NG2+ cells (P < 0.001, Kaplan–Meier, H).

