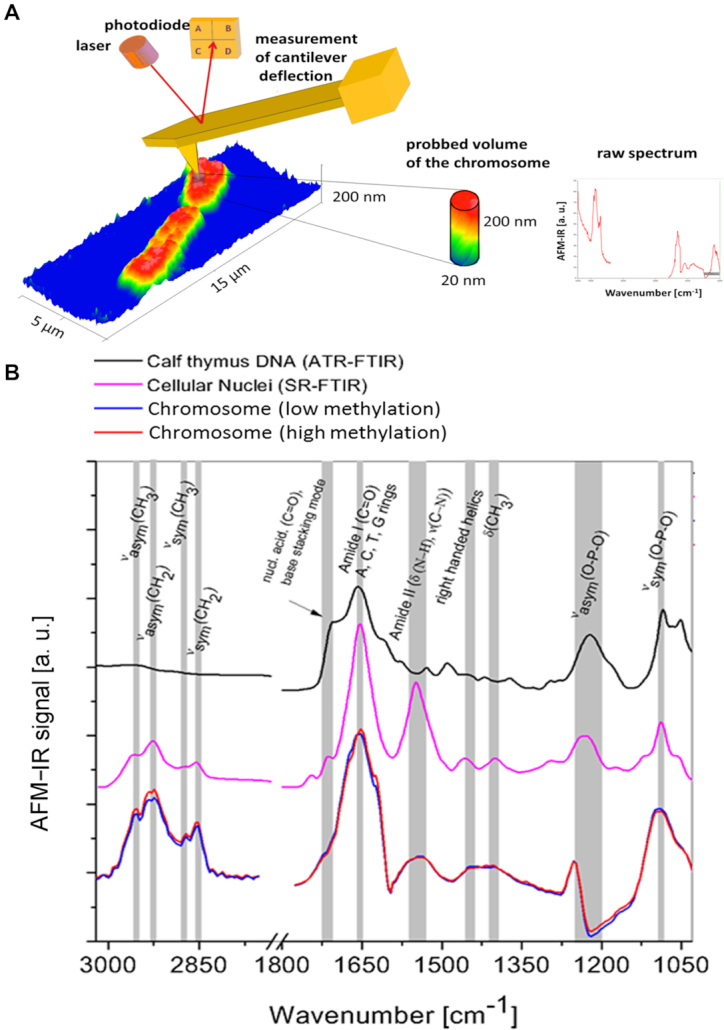
Figure 1.

(A) a scheme of chromosome spectra acquisition via AFM-IR (B) A comparison of two kinds of AFM-IR spectra collected from three independent chromosomes (80 AFM-IR spectra were averaged for each spectrum kind: blue and red) with SR-FTIR a spectrum of cellular nuclei collected with the infrared microscope at the Australian Synchrotron (pink) along with a spectrum of ATR-FTIR spectrum of Calf thymus DNA (black).
