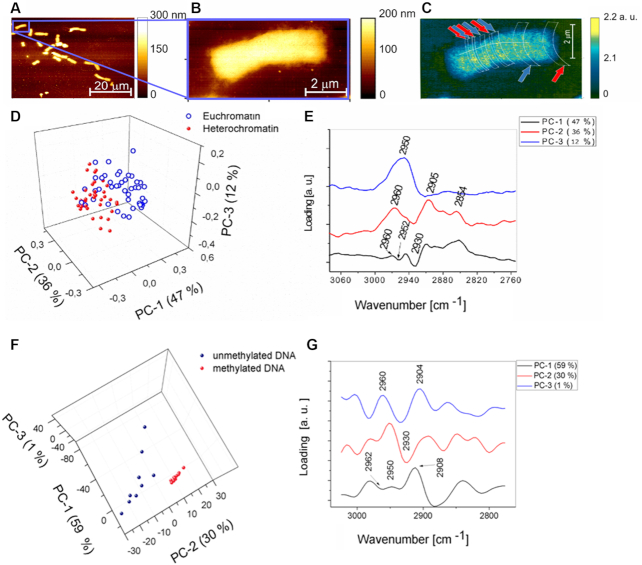
Figure 4.
The results of PCA performed on spectra collected from a single chromosome and DNA in the spectral range from 3070 cm−1 to 2755 cm−1. (A) AFM topography of chromosomes isolated from HeLa cells, chromosome thickness 70–90 nm. (B) AFM topography of one chromosome isolated from HeLa cells. (C) The ratio of the absorption for the 2952 cm−1/1240 cm−1 bands with areas of the spectral collection marked by red arrows (heterochromatin) and blue arrows (euchromatin) where the spectra were recorded pixel size 6.4 × 6.4 nm. (D) Scores plot of spectra collected from a single chromosome presented in (C) showing scores projected onto PC-1, PC-2, PC-3. (E) Loadings plot corresponding showing loadings explaining the separation along PC-1, PC-2 and PC-3 presented in (D). (F) Scores plot of DNA spectra showing scores projected onto PC-1, PC-2, PC-3. (G) Loadings plot showing loadings explaining the separation along PC-1, PC-2 and PC-3 presented in (F).

