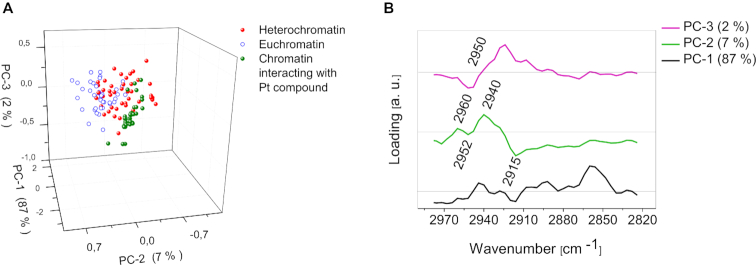
Figure 7.
Classification spectra collected from chromatin interacting with the Pt-103, PCA analysis: (A) scores plot showing the clustering of spectra collected from eu- (blue) and heterochromatin (red) areas of single chromosome and spectra collected from chromatin interacting with the drug in eight various chromosomes (green) in the spectral range from 3070 cm−1 to 2755 cm−1, (B) loadings plot for A.

