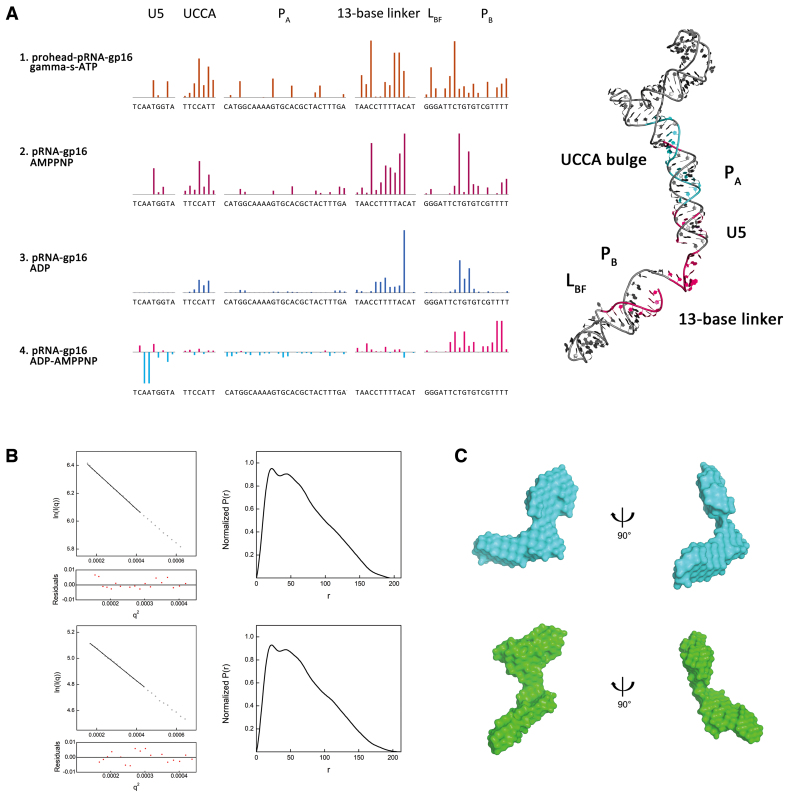
Figure 3.
ATP and ADP modulate the pRNA-gp16 RNP conformational change. (A) Quantitative analysis of the RNP SHAPE data reveals that the ATP and ADP induce two different pRNA conformations. Row 1 brown bars represent protected residues caused by ATP binding in prohead–pRNA–gp16, namely UCCA-bulge, the 13-base linker and PB in domain II. Row 2 purple bars show the ATP protection sites in pRNA–gp16. Row 3 indicates protected residues due to ADP binding. Row 4 shows the differential protection pattern between ATP and ADP. Positive magenta bars represent the ATP-induced protection relative to ADP binding. Right panel: protected residues mapped on the 3D structure of full-length pRNA structure. Coloring is consistent across all panels. Residues are indicated on the X-axis. (B) Guinier plot (left) and normalized P(r) analysis (right) of the ATP-bound RNP (upper series) ADP-bound RNP (lower series). (C) SAXS bead models of the ATP-bound (cyan, upper) and ADP-bound (green, lower) RNP.

