Figure 3.
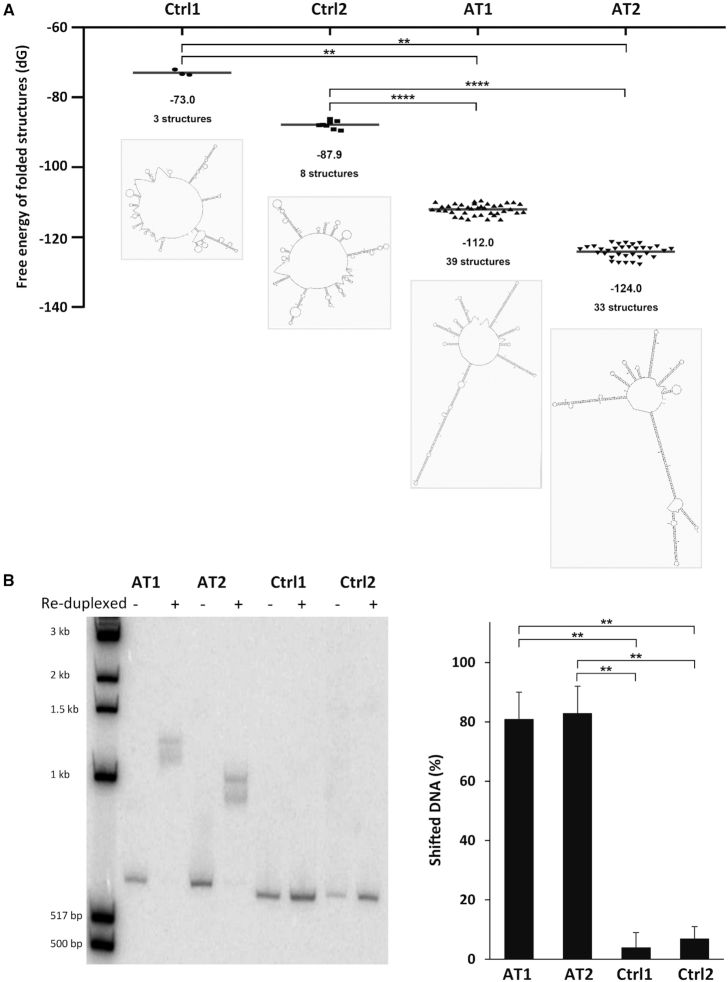
Secondary structure formation by FRA16C AT-DRSs. (A) In silico predictions of the folding ability of ∼550 bp long DNA fragments derived from the integrated 3.4 kb AT-DRS (AT1 and AT2) or control sequences from the vector pHPRThyg (Ctrl1 and Ctrl2) were performed by the Mfold algorithm (30). The fragments sequences are shown in Supplementary Figure S6. Dots represent the free energy values of predicted folded structures. The average free energy and the number of predicted secondary structures are shown below the dots. An illustration of the most stable secondary structure for each fragment is also shown. **P < 0.01, ****P < 0.0001. (B) The same DNA fragments analyzed by Mfold, represented in (A) and Supplementary Figure S6 (AT1, AT2, Ctrl1 and Ctrl2), were subjected to denaturation and reduplexing reaction and separated by gel electrophoresis. **P < 0.002.

