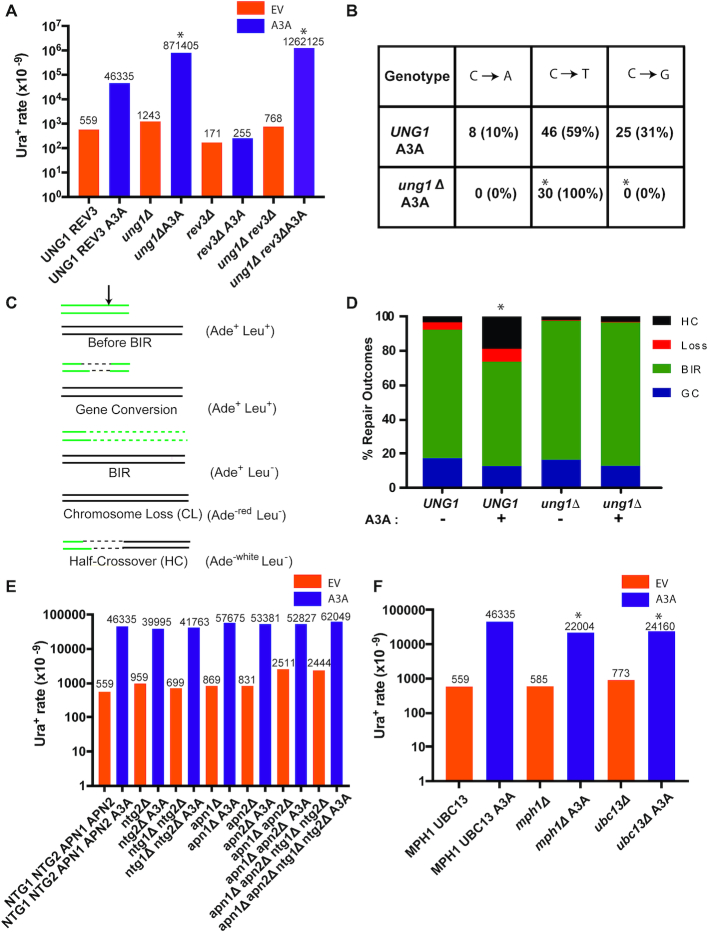
Figure 3.
Error-free bypass of abasic sites during BIR. (A) The rate of Ura+ mutations measured following BIR in the presence of A3A- or empty plasmids in strains bearing Ori2 ura3-29 at 90kb position. Mutation rates are increased in ung1Δ versus UNG1 in REV3-independent way. Asterisks indicate statistically significant differences from UNG1 strains. See Supplementary Table S3 for P-values, description of statistical analysis, 95% CI or the ranges of the medians, as well as for BIR efficiencies. (B) Mutation spectra of BIR-associated mutations from (A) in ung1Δ REV3 A3A and UNG1 REV3 A3A strains. Asterisks indicate statistically significant differences (P < 0.0001) from UNG1 strains. (C) Schematic depicting repair outcomes following DSB induction in yeast disomic strain. Black arrow denotes position of DSB. (D) The frequency of half-crossovers (HC) is increased (statistically significant increase is indicated by asterisk) in UNG1 as compared to ung1Δ following DSB induction in the presence of A3A. Loss: chromosome loss; GC: gene conversion. (E) The rates of Ura+ following DSB repair in the presence of A3A or empty vector in various base-excision repair mutant backgrounds. The median values of the mutation rates calculated for ≥6 experiments are indicated above the bars. Absence of asterisk indicates no statistical difference between groups. See Supplementary Table S3 for P-values, description of statistical analysis, 95% CI or the ranges of the medians, as well as for BIR efficiencies. (F) The rates of Ura+ following DSB repair in the presence of A3A or empty vector in various mutant backgrounds including mph1Δ and ubc13Δ. Asterisks indicate statistically significant differences from MPH1UBC13 strains. All other details are similar to (E). The data for the wt strain (NTG1 NTG2 APN1 APN2 MPH1 UBC13) are the same as in Figure 1 and Figure 2 and were obtained in parallel with the data for the mutants presented in this figure.

