Figure 4.
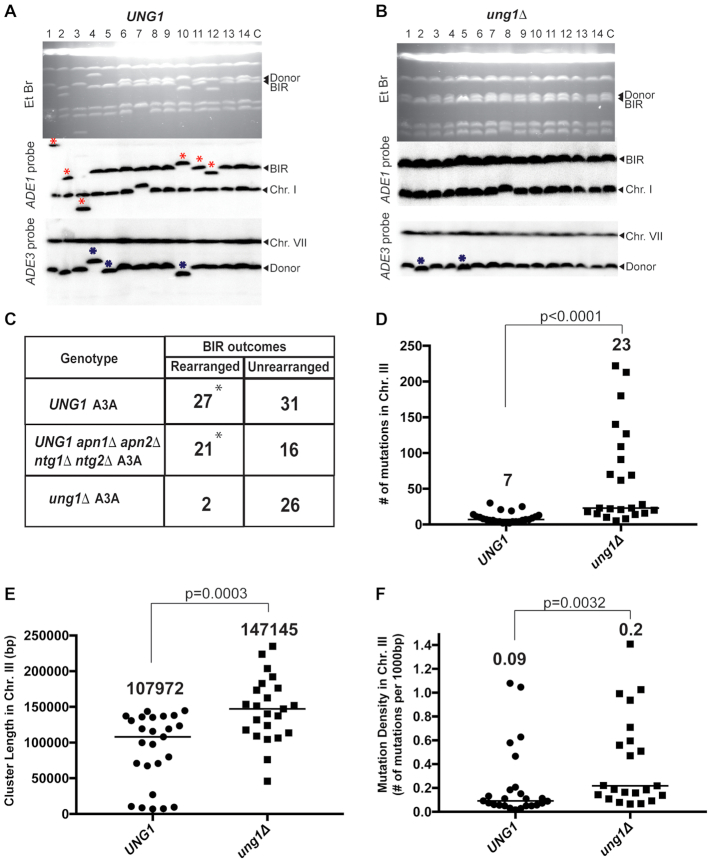
A3A-induced mutation clusters and gross chromosomal rearrangements (GCR) following BIR in UNG1 and ung1Δ strains. (A) CHEF gel analysis of Ura+ BIR outcomes from UNG1 and (B) ung1Δ strains. Top: ethidium bromide-stained CHEF gels; middle: Southern blot hybridization with ADE1-specific probe and with ADE3-specific probe (bottom). Lane labeled ‘C’: BIR repair control. Lanes labeled 1–14 Ura+ BIR outcomes. Red asterisks denote rearranged recipient (ADE1-containing) chromosome. Blue asterisks: rearranged donor (ADE3-containing) chromosome. (C) Rearranged chromosome frequency among Ura+ BIR/A3A outcomes in UNG1(that is also APN1 APN2 NTG1 NTG2), UNG1 apn1Δ apn2Δ ntg1Δ ntg2Δ and ung1Δ (that is also APN1 APN2 NTG1 NTG2). Asterisks indicate statistically significant differences (P = 0.0002) from ung1Δ strain. (D) BIR/A3A-associated mutation clusters in Chr. III detected by whole-genome sequencing (WGS). The number above scatter plots and the line indicate the median numbers of mutations per cluster in UNG1 and ung1Δ strains. P values are denoted on top of the line and were determined using the Mann–Whitney U test. (E) Comparison of BIR/A3A-associated mutation cluster lengths in UNG1 and ung1Δ. The number above scatter plots and the lines indicate the median lengths of BIR/A3A-associated mutation clusters in Chr. III. P values for the comparison between UNG1 and ung1Δ are denoted on top of the line and were determined using the Mann–Whitney U test. (F) Comparison of mutation density (mutations per 1000 bp) in Chr. III mutation clusters in UNG1 and ung1Δ. The median mutation densities are indicated. P values for the comparison between UNG1 and ung1Δ are denoted on top of the line and were determined using the Mann-Whitney U test.

