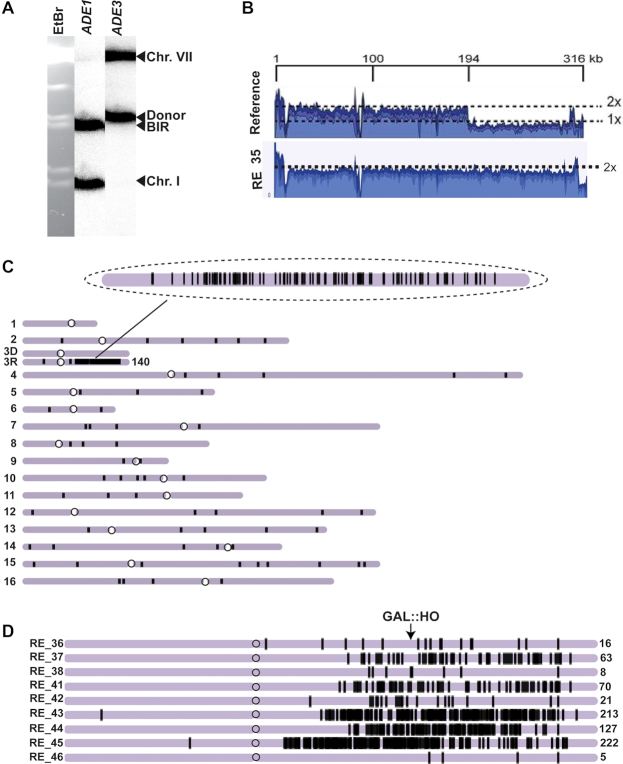
Figure 5.
Analysis of mutation clusters induced in ung1Δ by BIR/A3A. (A) CHEF gel analysis of a representative Ura+ BIR outcome (RE_35) isolated in ung1Δ. Left: ethidium bromide stained CHEF gel electrophoresis. Middle and right: Southern blot analysis using ADE1-and ADE3-specific probe, respectively. (B) Coverage of Illumina sequencing reads for a BIR event (RE_35) is increased two times for the chromosomal region located centromere-distal to MAT (positions >190,180bp) as compared to parental strain. (C) A3A-induced mutations (black vertical lines) in RE_35. Enlarged: mutation cluster on the track of BIR (D) Clustered mutations in Ura+ isolates. Positions of mutations (black lines) are depicted along the chromosome III reference. The total number of mutations in each cluster is indicated by a number (on the right).

