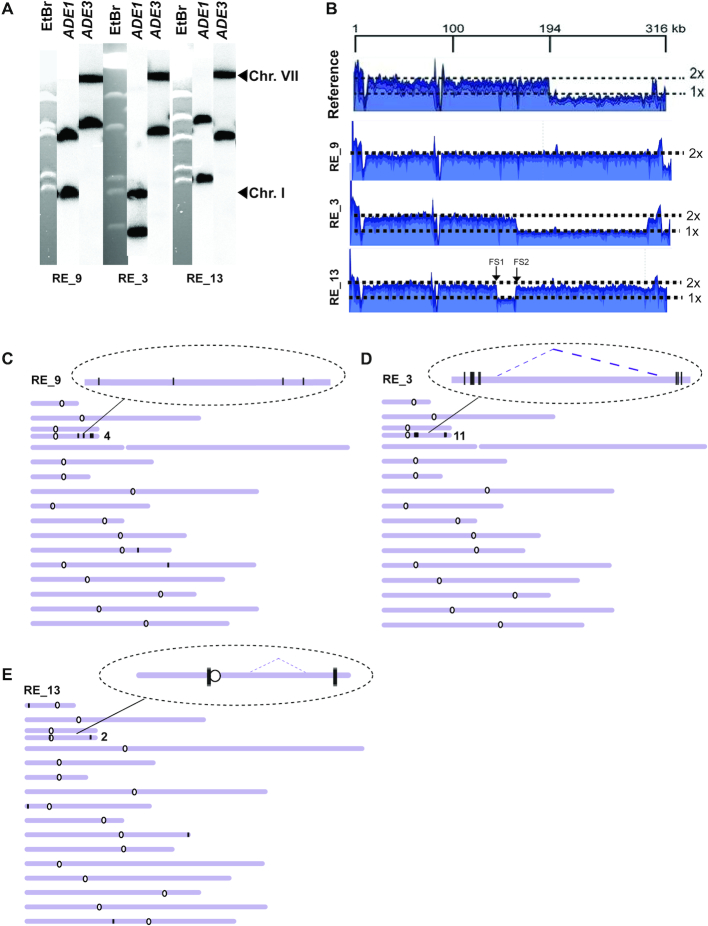
Figure 6.
Analysis of mutation clusters induced by BIR in the presence of A3A in UNG1. (A) CHEF gel analysis of representative Ura+ BIR outcomes (Not rearranged: RE_9; Rearranged: RE_3, RE_13). Left: ethidium bromide stained chromosomes separated by CHEF gel electrophoresis. Middle and right: Southern blot analysis using ADE1-specific probe and ADE3-specific probes, respectively. (B) Coverage of Illumina sequencing reads for RE_9, RE_3 and RE_13. 2X indicate fold-increase as compared to the parental strain. (C–E) A3A-induced mutations (black vertical lines) in RE_9 (C), RE_3 (D), and RE_13 (E). Enlarged: mutation clusters on the track of BIR. Dotted lines indicate the borders of large deletions. See the legend to Figure 5 for all other details.

