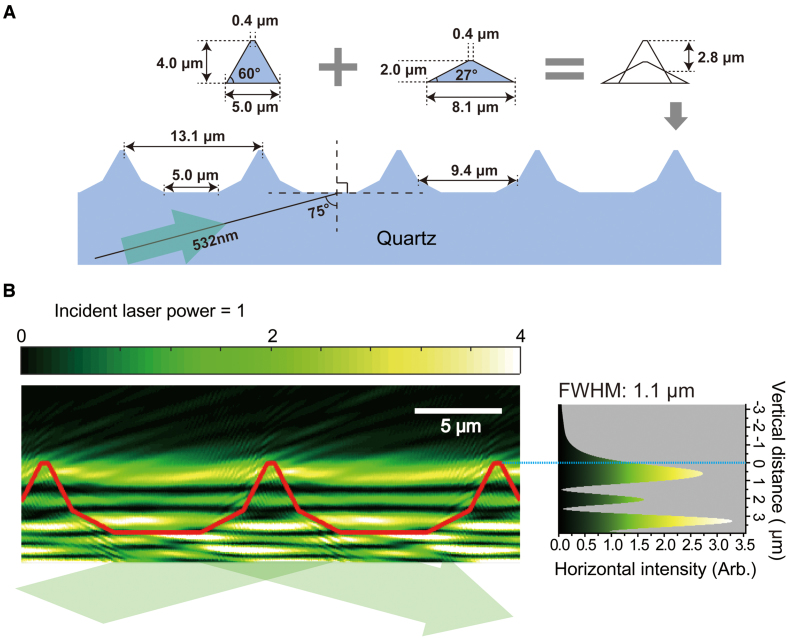
Figure 2.
Computer-aided simulation for the intensity profile of excitation in DNA skybridge. (A) A 3D structure for the simulation was built with angled slope blocks for 4.0 μm barriers in height and 13.1 μm spacing between two barriers. The angled boundary barrier resulted from the superposition of two equilateral trapezoids. One isosceles trapezoid has an upper base of 0.4 μm, a lower base of 5.0 μm and a height of 4.0 μm. The other trapezoid has an upper base of 0.4 μm, a lower base of 8.1 μm and a height of 2.0 μm. The center of the bottom line of both trapezoids is located at an identical position on the quartz surface for the simulation. The width of the bottom surface is 5.0 μm. (B) The intensity profile of the excitation light with a wavelength of 532 nm in a computer simulation. The incident angle and laser power are set to 75° and 1, respectively. The red line corresponds to the barrier boundary of the 3D structured quartz. The origin of the vertical distance is the top of the barriers (right). We took the average of the intensity of horizontal components, which is presented with the vertical distance (right).

