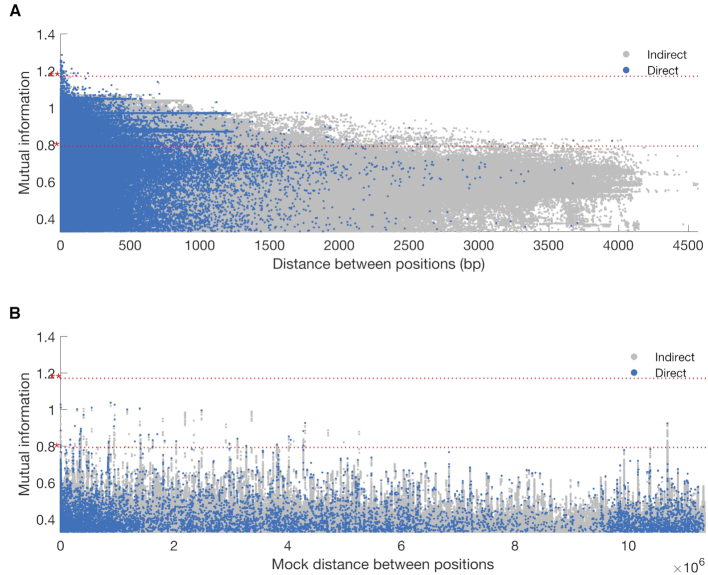
Figure 6.
Neisseria meningitidis: GWES Manhattan plots: (A) intra-gene links, (B) inter-gene links. The mock distance in (B) was calculated using the gene order in the actual alignment and is therefore not a true distance. Direct and indirect links are plotted in blue and gray, respectively. The red horizontal dotted lines show the outlier thresholds; outlier * and extreme outlier **.

