Figure 5.
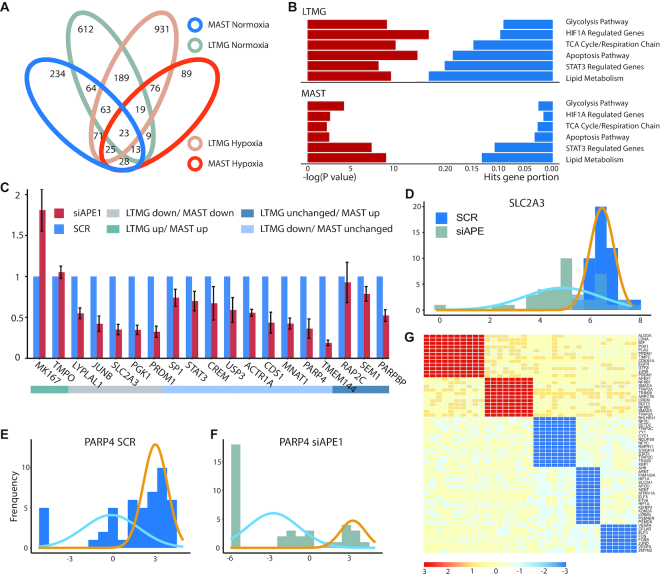
Experimental validation of LTMG-DGE. (A) Overlap of down-regulated genes in APE1/Ref-1-KD vs. SCR control in hypoxia and normoxia, identified by LTMG-DGE and MAST. (B) Enrichment of the genes down-regulated in APE1/Ref-1-KD versus SCR control in key APE1/Ref-1 related pathway, under hypoxic conditions. (C) Expression of selected genes analyzed by qPCR of Pa03C cells transfected with APE1/Ref-1 siRNA and placed under hypoxia for 24 h. (D–F) Expression profile of SLC2A3 and PARP4 in APE1/Ref-1-KD (siAPE) and control (SCR) under hypoxia. Gene expression level is quantified by log(RPKM) and represented on the x-axis. Gold and blue curves represent peaks correspond to different TRSs. (G) Bi-cluster structures of gene coregulation modules enriched by STAT3 and HIF1A regulated genes. The x-axis represents samples and y axis represents genes. AE and SE status of a gene in a sample are colored by red and blue, respectively.

