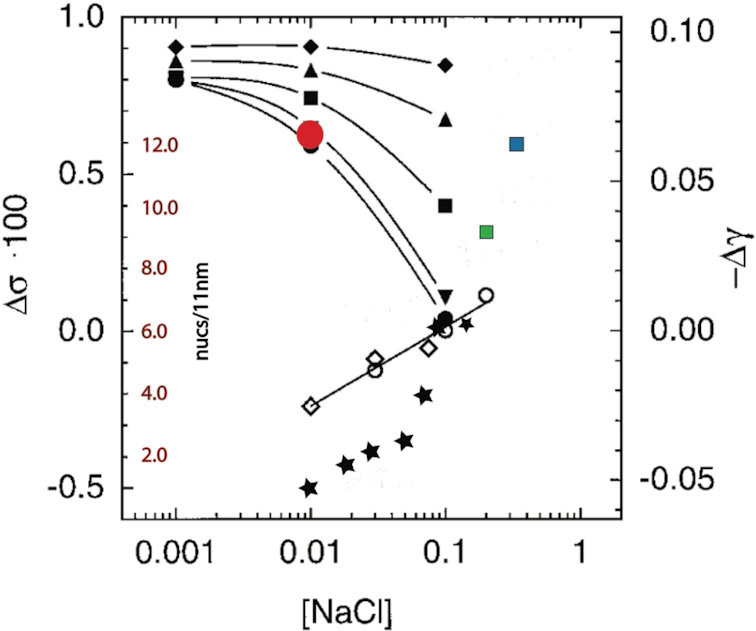
Figure 12.

Correlation of cation-dependent change in DNA helical repeat adapted from (28) and fibre density (14,15,19,26). These data are plotted according to the X+ and Mg2+ concentrations used. Where appropriate (i.e. when K+ was used instead of Na+) X+ is plotted in terms of Na+ equivalents according to ref. 27). Symbols from ref. 28): open diamonds, filled circles, inverted triangles, squares, triangles, filled diamonds - [Na+] with successively 0, 0.5, 1, 2, 5 mM [Mg2+]; fibre data: filled stars, red circle, green square, blue square from, respectively, (26,19,14,15). Note that the data from (26) indicate a 2-phase folding pathway as further described in Supplementary Figure S3.
