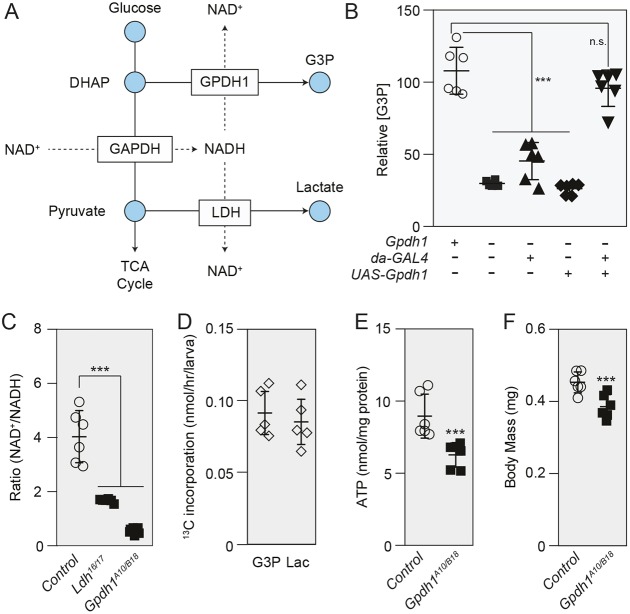
Fig. 3.
GPDH1 controls NAD+/NADH redox balance during larval development. (A) Diagram illustrating how GPDH1 and LDH redundantly influence NAD+ levels. (B) GC-MS was used to measure relative G3P abundance in mid-L2 larvae for the following five genotypes (as presented left to right in the figure): Gpdh1B18/+, Gpdh1A10/B18, Gpdh1A10/B18; da-GAL4/+, GpdhA10/B18; UAS-Gpdh1 and Gpdh1A10/B18; da-GAL4 UAS-Gpdh1. (C) NAD+/NADH ratio in mid-L2 larvae of genotypes Gpdh1B18/+, Ldh16/17 and Gpdh1A10/B18. (D) Mid-L2 larvae were fed D-glucose-13C6 for 2 h and the rates of 13C isotope incorporation into lactate and G3P were determined based on m+3 isotopologue abundance. (E) ATP levels were significantly decreased in Gpdh1A10/B18 compared with Gpdh1B18/+ controls. (F) The body mass of Gpdh1A10/B18 larvae was significantly lower than that of Gpdh1B18/+ controls 0-4 h after the L2-L3 molt. In B,C,E,F, n=6 biological replicates per genotype; in D, n=5 biological replicates per genotype. Error bars represent s.d. For B and C, the P-value was adjusted for multiple comparisons using the Bonferroni–Dunn method; ***P<0.001. All experiments were repeated a minimum of two times. G3P, glycerol-3-phosphate; DHAP, dihydroxyacetone phosphate; Lac, lactate.

