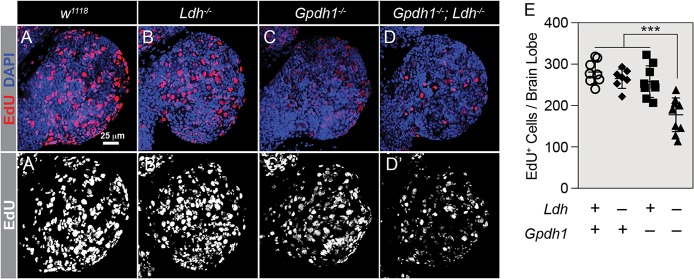
Fig. 5.
EdU labeling of Gpdh1; Ldh double mutants. (A-D) Maximum projections of the dorsal half of size-matched L2 larval brains stained with EdU (red) and DAPI (blue) from w1118 controls (A), Ldh16/17 mutants (B), Gpdh1A10/B18 mutants (C) and Gpdh1A10/B18; Ldh16/17 double mutants (D). The scale bar in A applies to A-D. Note that A′-D′ display EdU staining alone in grayscale. (E) Histogram of the number of EdU-positive cells per dorsal brain lobe per genotype. Error bars represent s.d. P-value adjusted for multiple comparisons using the Bonferroni–Dunn method; ***P<0.001.

