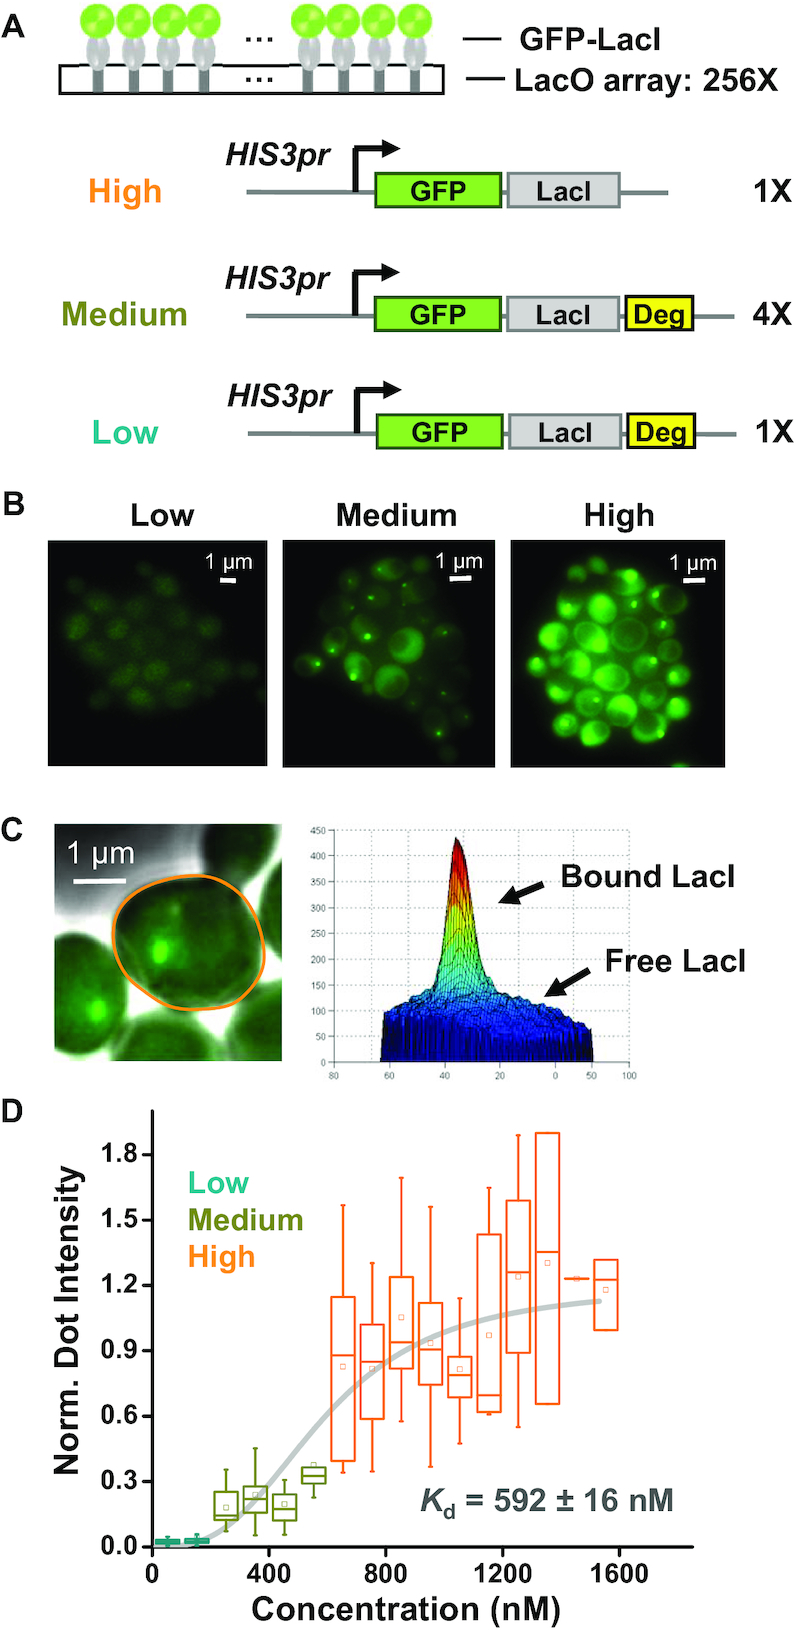
Figure 1.

LacI shows large apparent Kd in a commonly used FROS. (A) Scheme of FROS where GFP labeled LacI is recruited to arrays of LacO with 256 repeats (256×; same notation is used below). GFP-LacI is driven by HIS3 promoter ± the destabilization sequence (deg). These constructs were integrated into the yeast genome with different copy numbers to generate variable concentrations of the fusion protein. (B) Fluorescent images of the FROS at different GFP-LacI concentrations. All images are shown with the same brightness and contrast (same as below). (C) Measurement of the amount of bound versus free GFP-LacI. The right panel shows the intensity profile of the highlighted cell in the left panel, where the peak reflects the fluorescence generated by the bound GFP-LacI, and the background by the free ones. See Supplementary Figure S1 and ‘Materials and Methods’ section for detailed quantification method. (D) Measurement of the dissociation constant, Kd. The box plot shows the normalized dot intensity versus background GFP-LacI concentration measured in individual cells (total number of cells: N = 268). The data were binned into 100 nM windows and fitted by a Hill function with Kd = 592 ±16 nM and hill coefficient n = 2.93 ± 0.42. Error bars shown here represent 5th to 95th percentile (same as below).
