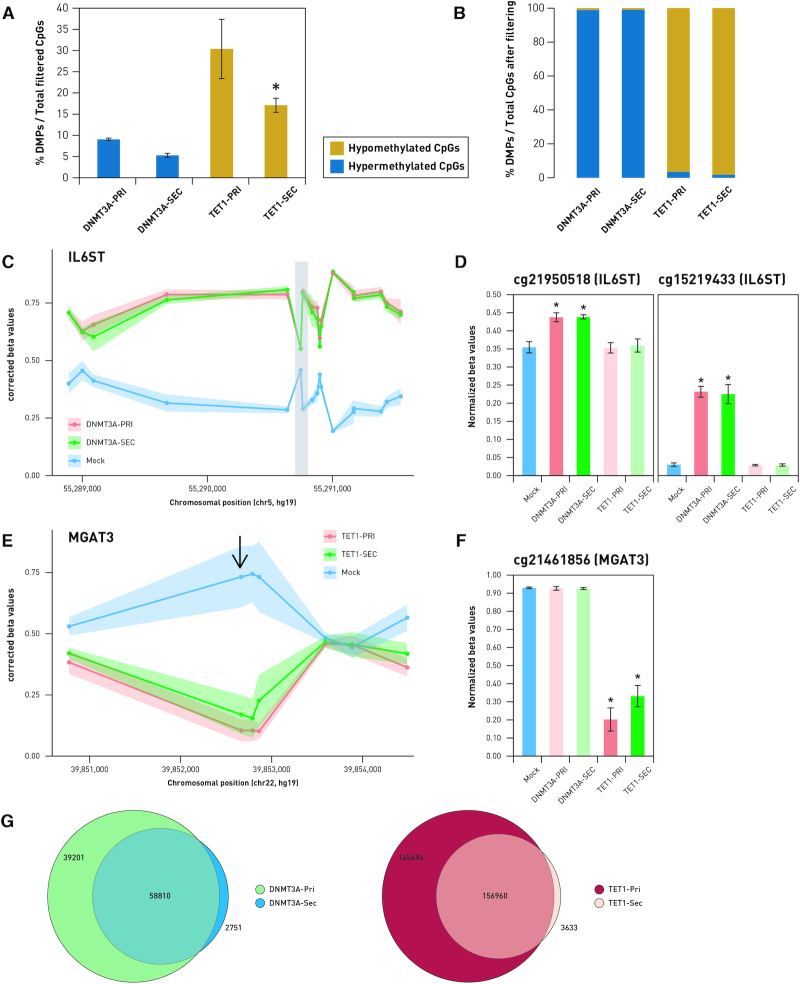
Figure 8.
Analysis of whole-genome methylation following epigenetic modulation of the IL6ST/MGAT3 promoters using DNMT3A-dSpCas9 and TET1-dSpCas9 fusion constructs. (A) Fraction of differentially methylated probes compared to mock controls against total filtered probes analyzed on the Infinium MethylationEPIC array. Labels DNMT3A-PRI/TET1-PRI and DNMT3A-SEC/TET1-SEC indicate ‘primary’ and ‘secondary cassette’, respectively. (B) Fraction of differentially methylated probes, which were hypermethylated or hypomethylated, compared to mock controls in cells transfected with DNMT3A-dSpCas9 and TET1-dSpCas9 fusions. (C and E) Dots represent CpG sites targeted by DNMT3A-dSpCas9 and TET1-dSpCas9 fusion constructs. Lines show pattern of methylation (C) and demethylation (E) change at CpG island of IL6ST and MGAT3 genes. Comparison of CpG methylation patterns induced by DNMT3A-dSpCas9 expressed under strong (‘primary cassette’) or weak (‘secondary cassette’) promoter on probes located 2500 bp up- and downstream of the targeted region (shaded in gray) of IL6ST is shown on (C). Changes to β-values in the two probes lying within this region are illustrated on (D). (E) Comparison of DNA methylation patterns induced by TET1-dSpCas9 primary and secondary cassettes 2500 bp up- and downstream of the targeted region of the MGAT3 promoter region. The probe cg21461856 is the only one lying within this region (indicated with the arrow). Changes to β-values in cg21461856 are illustrated in the graph (F). (G) Venn diagrams illustrating overlap between DMPs induced by the primary and secondary cassettes of DNMT3A-dSpCas9 and TET1-dSpCas9 fusions. * P < 0.05.

