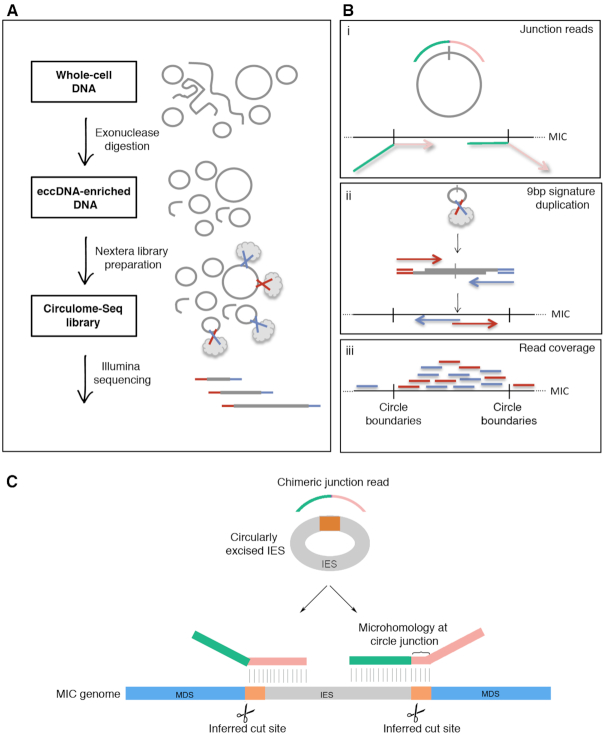
Figure 2.
Experimental and bioinformatic pipeline to identify eccDNA in Oxytricha genome-wide. (A) Experimental pipeline to enrich for and sequence eccDNAs. Gray lines represent whole-cell DNA (either linear or circular). Gray clouds represent the Nextera transposome, which simultaneously fragments DNA and ligates the blue and red Illumina sequencing primers to the DNA fragments. (B) Three bioinformatic metrics are used to identify eccDNA: (i) Junction reads in which the 5′ and 3′ portions of chimeric-reads (green and pink) coming from circle junctions map to the linear MIC genome assembly in a permuted order, as shown, (ii) When a small circular DNA molecule is cut only once by the Nextera transposome, via a 9 bp staggered cut, it will produce a signature 9 bp duplication at the 5′ ends of the reads in a pair that is a bioinformatic signature for circular topology in non-repetitive regions, (iii) Exonuclease digested libraries will have increased coverage in loci that give rise to eccDNA, compared to non-exonuclease treated samples. Paired-end reads are represented as two lines where the two reads in a pair are red and blue. (C) Hypothetical pathway for the excision of an IES (in gray) via recombination at pointers (orange). The circular junction read is shown as part green and part pink to illustrate regions of partial MIC alignment, where the pink and green portions map upstream and downstream of the IES, respectively. The coordinates for the split alignments for a circular junction read can then be used to infer (i) cut sites that would lead to the excision of the IES and (ii) whether direct repeats flank the circularly excised loci.

