Figure 5.
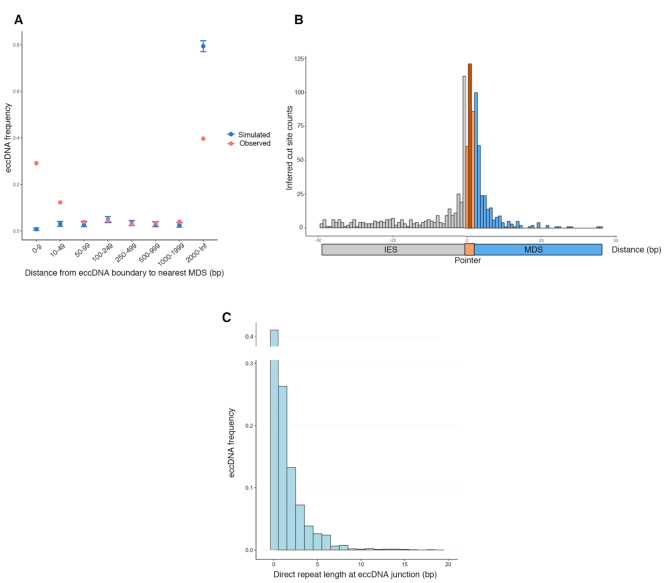
Characteristics of high confidence rearrangement-specific eccDNA. (A) For the 2432 high confidence eccDNA identified in mid-rearrangement, the distance to the nearest MDS boundary was measured and shown as red points. The distances are binned according to the values specified on the x-axis. The set of 2432 high confidence eccDNA were randomized 500 times across the MIC assembly and the blue points represent the mean frequency of each bin for the simulated data. The error bars on the simulated data represent three standard deviations. (B) The locations of 933 cut sites inferred from high confidence eccDNA that are within 50 bp of an MDS boundary that also have high confidence pointer annotations are shown. Each bar represents 1 bp, with the exception of the dark orange bar in the middle of the pointer, which represents all cut sites within variable length pointers. The distribution of cut sites inside IESs is significantly different from the distribution of cut sites inside MDSs (Kolmogorov–Smirnov test, P-value = 4.108 × 10⁻¹⁵). (C) The length of the direct repeats flanking circularly excised loci for the 2432 high confidence eccDNA are shown.

