
Figure 6.
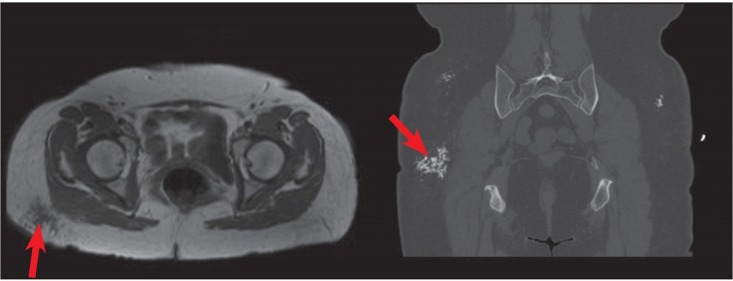
T1 weighted non-contrast MRI (left-red arrow) of dystrophic calcifications show hypointense signal in patchy patterns. These appear as calicified hazy patches on CT (right-red arrow).
Official websites use .gov
A
.gov website belongs to an official
government organization in the United States.
Secure .gov websites use HTTPS
A lock (
) or https:// means you've safely
connected to the .gov website. Share sensitive
information only on official, secure websites.
T1 weighted non-contrast MRI (left-red arrow) of dystrophic calcifications show hypointense signal in patchy patterns. These appear as calicified hazy patches on CT (right-red arrow).