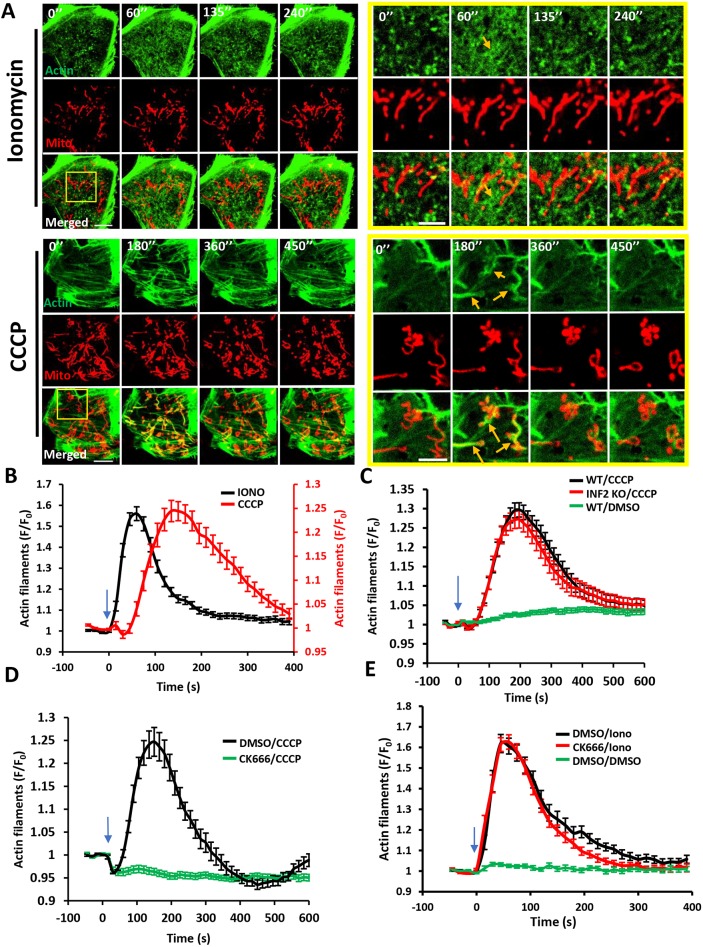
Fig. 1.
Distinct actin structures assemble in response to two stimuli: increased cytoplasmic calcium and mitochondrial depolarization. (A) Time-lapse image montage of ionomycin-induced (top) and CCCP-induced (bottom) actin polymerization for U2OS cells transfected with GFP–F-tractin (green) and mito–BFP (red). Imaging conducted at the basal cell surface. Ionomycin or CCCP added at time point 0. Scale bars: 10 μm (insets 5 μm). Corresponds to Movies 1 and 2. Movies 3 and 4 show similar time course in medial cell section. Orange arrows indicate actin assembly. (B) Comparison of ionomycin-induced and CCCP-induced actin polymerization time course for U2OS cells (15 s intervals); N=30 cells/60 ROIs for ionomycin (4 μM) treatment, 27 cells/27 ROIs for CCCP (20 μM) treatment. (C) CCCP-induced actin polymerization in U2OS-WT and U2OS-INF2-KO cells (14 s intervals); N=35 cells for WT, 35 cells for INF2-KO and 35 cells for WT cells stimulated with DMSO. (D) Effect of Arp2/3 complex inhibition on CCCP-induced actin polymerization (15 s intervals). U2OS cells were treated with either DMSO or 100 μM CK666 for 30 min and then stimulated with 20 μM CCCP; N=35 cells/35 ROIs for DMSO/CCCP, 41/41 for CK666/CCCP. (E) Effect of Arp2/3 complex inhibition on ionomycin-induced actin polymerization (15 s intervals). U2OS cells were treated with either DMSO or 100 μM CK666 for 30 min and then stimulated with DMSO or 4 μM ionomycin; N=23 cells/46 ROI for DMSO/ionomycin, 25/50 for CK666/ionomycin and 20/40 for DMSO/DMSO. All data (mean±s.e.m.) are from three experiments. Blue arrows denote drug addition.

