Fig. 4.
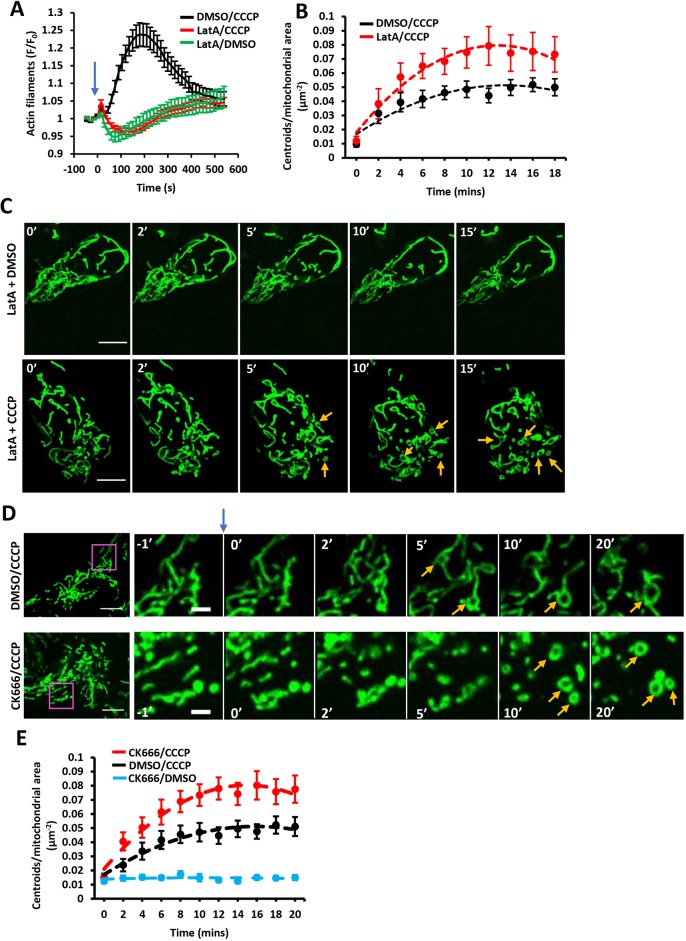
Effect of LatA and Arp2/3 complex inhibition on depolarization-induced mitochondrial shape changes. (A) Effect of LatA on CCCP-induced actin polymerization. U2OS cells were treated with combinations of LatA (500 nM) and CCCP (20 μM) at time 0 (blue arrow). Confocal images (medial section) were acquired at 15 s intervals starting four frames before treatment. Data (mean±s.e.m.) are from three experiments; N=23 cells/23 ROIs for LatA/DMSO, 38/38 for LatA/CCCP and 31/31 for DMSO/CCCP. (B) Effect of LatA on CCCP-induced mitochondrial matrix circularization (‘centroids’). U2OS cells were transfected with mito–BFP and GFP–F-tractin. CCCP (20 μM) was added at time point 0, simultaneously with LatA addition (500 nM). Data (mean±s.e.m.) are from three experiments; N=22 cells/4354 μm2 total mitochondrial area for DMSO/CCCP control cells; 18 cells/3823 μm2 for LatA/CCCP. Mean±s.e.m. P-value for time points 4–18 min post-treatment was 0.0115±0.0119 for DMSO versus LatA. (C) Time-course montage of LatA-treated cells under control conditions (DMSO treatment, top) or CCCP treatment (20 μM, bottom). U2OS cells transfected with F-tractin (not shown) and mito–BFP (green) were treated with 500 nM LatA and CCCP or DMSO simultaneously at 0 min. Confocal images (basal section) acquired at 15 s intervals starting four frames before treatment. Orange arrows denote centroids (circular mitochondrial matrix). (D) Time-course montage of CCCP-induced mitochondrial matrix circularization in the absence (top) or presence (bottom) of CK666 pretreatment. U2OS cells transfected with GFP–F-tractin (not shown) and mito–BFP (green) were treated with DMSO or CK666 (100 μM) for 30 min before stimulation with 20 μM CCCP at time point 0 (blue arrow). Confocal images (basal section) were acquired at 15 s intervals starting four frames before CCCP treatment. Orange arrows denote centroids (circular mitochondrial matrix). Corresponds to Movie 9. (E) Change in mitochondrial matrix circularization (defined as centroids per total mitochondrial area in the region of interest) from time-courses as described in A. Data (mean±s.e.m.) from three experiments. The three conditions tested were CK666 pretreatment followed by CCCP stimulation (N=46 cells/8539 μm2 total mitochondrial area), DMSO pretreatment, followed by CCCP stimulation (58 cells/11473 total mitochondrial area) and CK666 pretreatment followed by DMSO stimulation (36 cells/6655 total mitochondrial area). Mean±s.e.m. P-value for time points 4–18 min post-treatment was 0.00141±0.00217 for CK666/CCCP versus DMSO/CCCP. Scale bars: 10 μm in C; 10 μm in D (insets 2.5 μm).

