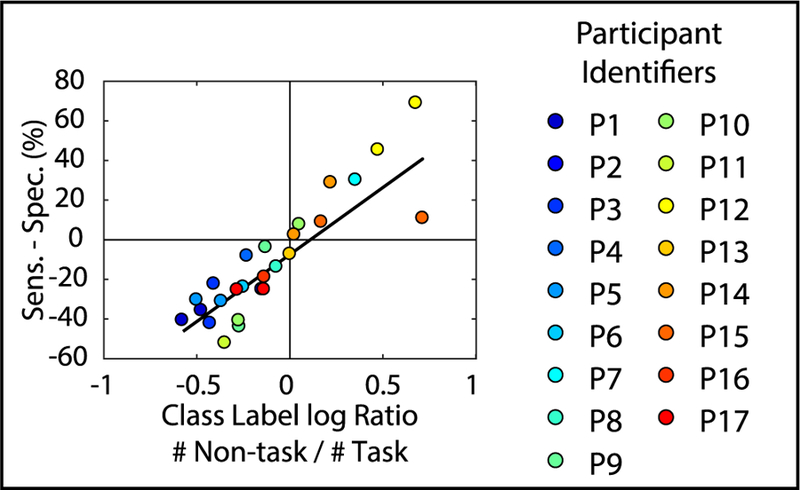
Figure 4.

Difference between specificity and sensitivity has a linear relationship with the ratio of task to non-task observations present in the original dataset. Difference between sensitivity and specificity for MSIT versus non-task and ECR versus non-task frequency domain classification results is plotted across participants against the ratio between the number of non-task to task observations present in the dataset before class balancing (linear regression: R2 = 0.72).
