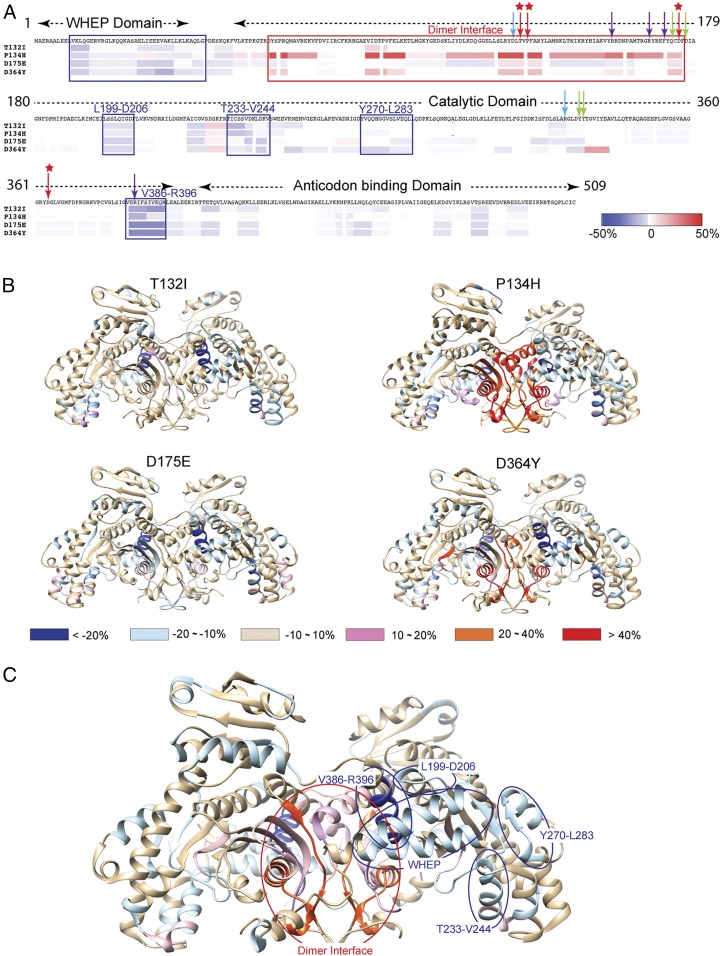
Fig. 5.
HDX analysis. (A) Differential deuterium incorporation induced by each of the 4 CMT2W mutations after 10,000 s of HDX mapped onto the HisRS sequence. Blue rectangles indicate consensus regions that show a decrease in deuterium incorporation compared with the WT, while the red rectangle indicates a region with increased deuterium incorporation. The arrows indicate the CMT2W-causing mutations (red) and the residues involved in histidine binding (green), ATP binding (purple), or both (blue). (B) Mapping differential deuterium incorporation induced by each CMT2W mutation onto the HisRS dimer crystal structure. (C) Average levels of deuterium incorporation change induced by the 4 CMT2W mutations mapped onto the dimeric HisRS crystal structure.

