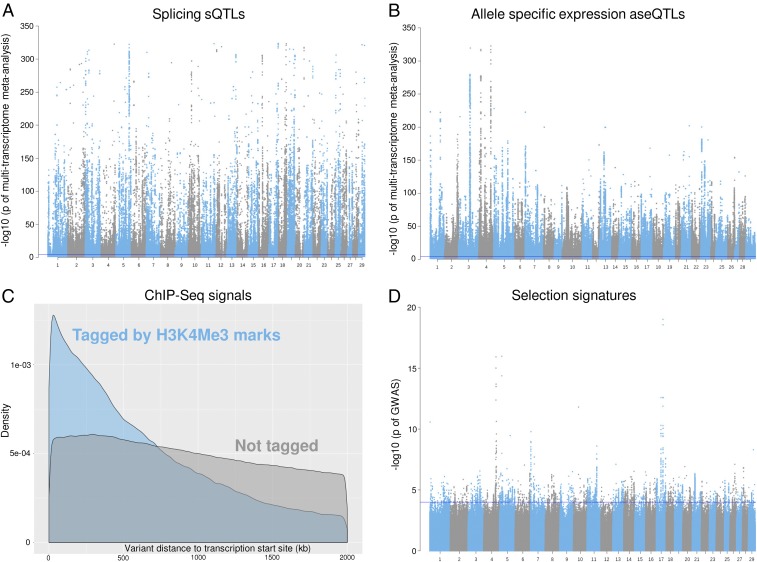
Fig. 2.
Examples of regulatory and evolutionary signals from the discovery analysis. (A) A Manhattan plot of the metaanalysis of sQTLs from white blood and milk cells and liver and muscle tissues. (B) A Manhattan plot of the metaanalysis of aseQTLs in the white blood cells. (C) A distribution density plot of variants tagged by H3K4Me3 ChIP-seq mark from mammary gland within 2 Mb of gene transcription start site. (D) Artificial selection signatures between 8 dairy and 7 beef cattle breeds with the linear mixed-model approach using the 1000 Bull Genome database. The blue line indicates −log10(P value) = 4.

