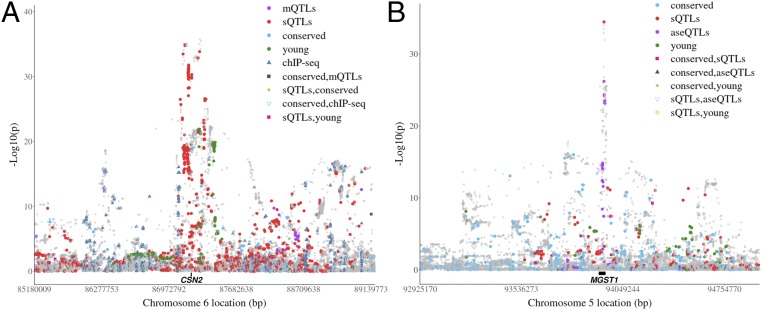
Fig. 4.
Examples of top-ranked variant sets in important bovine trait QTL. (A) Manhattan plot of the metaanalysis of GWAS of 34 traits in the ±2 Mb region surrounding the beta casein (CSN2) gene, a major QTL for milk protein yield. (B) Manhattan plot of the metaanalysis of GWAS of 34 traits in the ±1 Mb region of the microsomal GST 1 (MGST1) gene, a major QTL for milk fat yield. The dots are colored based on their set memberships. The black bar between the gray dots and the X-axis indicates the gene locations.

