Fig. 1.
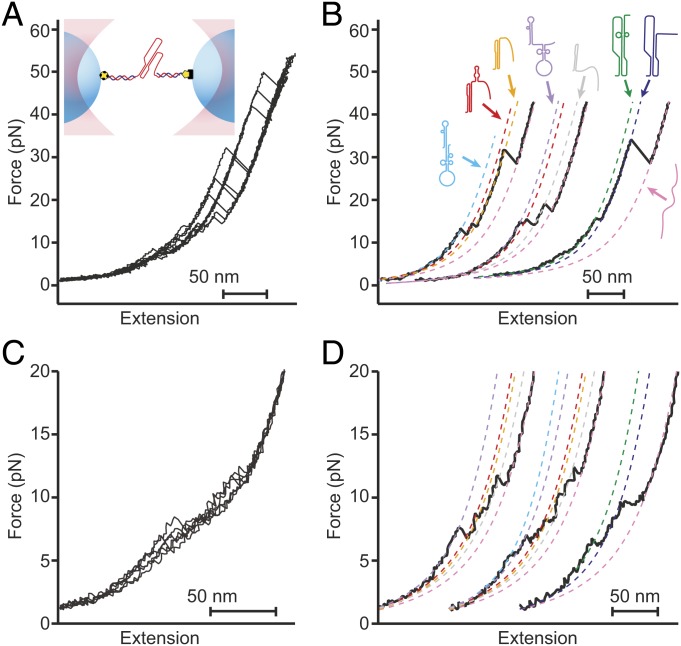
Force spectroscopy measurements of the WNV frameshift signal. (A) Representative unfolding FECs from the same molecule showing multiple “rips” where the extension increases when different parts of the structure unfold as the force is ramped up. (Inset) The frameshift signal is held under tension via duplex handles connected to beads held in optical traps. (B) Fitting unfolding FECs (black) to WLC models containing different amounts of unfolded RNA (dashed lines) reveals multiple different conformations of the frameshift signal. Cartoons show proposed structures for the different states based on observed length changes and unfolding forces. (C) Representative refolding FECs showing heterogeneous behavior as in unfolding curves. (D) WLC fits (dashed lines) to refolding curves (black) reveal the same set of states (color-coded as in B) as seen in unfolding curves.

