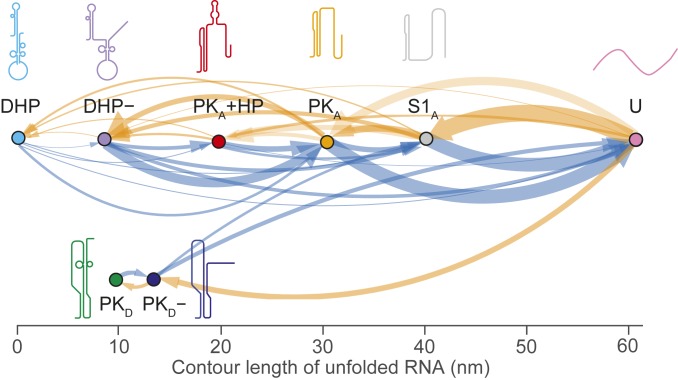
Fig. 4.
Transition map of unfolding and refolding pathways. All pairwise transitions between states observed in unfolding (blue) and refolding (orange) FECs are shown, with the thickness of each arrow proportional to the probability of observing the associated transition. The same 2 distinct pathways are seen for both unfolding and refolding.

