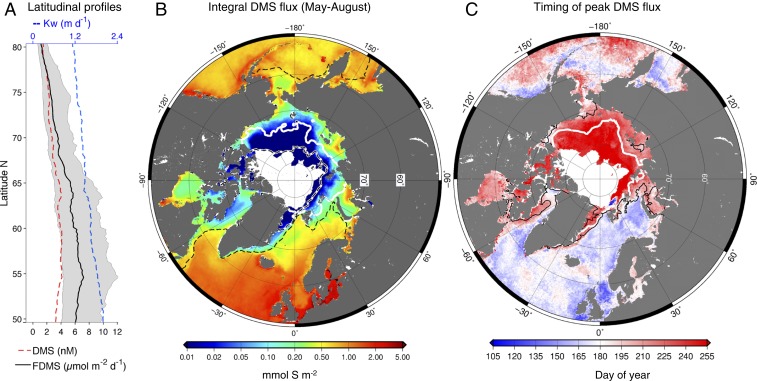
Fig. 2.
Spatial distribution and timing of summertime DMS emission in May through August 2003–2016. (A) Median latitudinal profile in ice-free pixels of sea-surface DMS concentration, sea–air flux (FDMS; interquartile range is shaded), and sea–air gas-exchange coefficient (Kw); (B) integral summertime FDMS between year days 121 and 248; (C) mean day of the annual peak in sea–air DMS flux. Contour lines in B show: 2003–2016 median of maximal late winter ice extent (black dashed line); minimal early September ice extent in 2003 (white line); minimal early September ice extent in 2012 (black dashed on white line). Contours in C enclose the area where: more than 50% of the summertime DMS emission occurs during a 24-d period centered on the annual peak (black line); the duration of the ice-free season is shorter than 48 d (white line) (medians of the 2003–2016 period).

