Fig. 3.
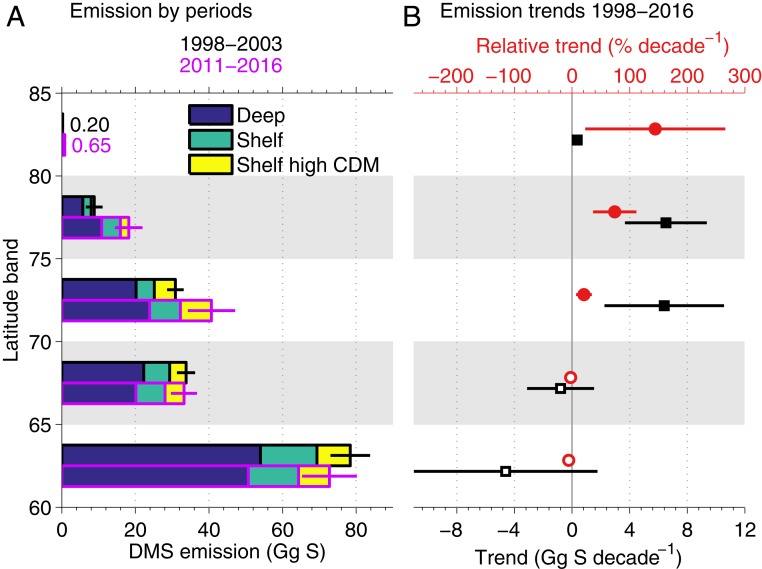
Mean zonal trends in summertime (May–August) EDMS. (A) EDMS mean ± SD for 1998–2003 (black line) and 2011–2016 (gray line); emissions are broken down into deep-ocean basins and continental shelves. The latter are further divided to show waters with strong riverine influence as depicted by high content of CDM that increases uncertainty in satellite Chl retrievals. (B) EDMS trends for the period 1998–2016 (black squares), and corresponding relative increase with respect to the 1998–2003 baseline period (red circles). Filled symbols mark significant trends at 95% confidence level, and error bars show the SE of the linear regression slope (which is sometimes smaller than the symbols).

