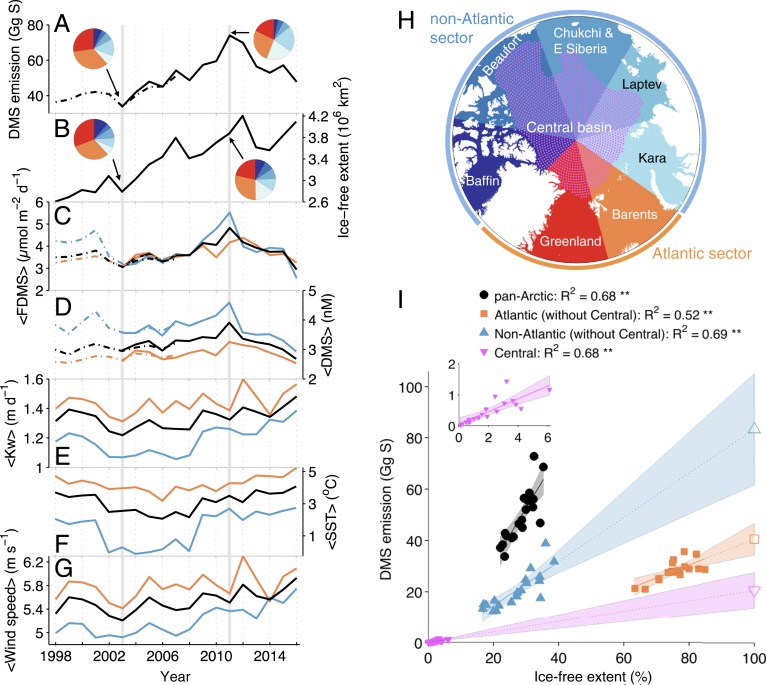
Fig. 4.
Interannual variations in EDMS and its driving factors north of 70°N. All panels show May–August integrals (EDMS) or means (other variables). (A) EDMS, (B) mean ice-free ocean extent, (C) mean FDMS, (D) mean DMS concentration, (E) sea–air DMS transfer coefficient (Kw), (F) SST, (G) wind speed. Values in C–G correspond to ice-free pixels only. Different lines correspond to the whole domain >70°N and its division into 2 sectors: Atlantic-influenced and non-Atlantic regions, according to the map in H. The pie charts in A and B illustrate the relative contribution of different source regions (colored following H) to EDMS, and their corresponding share of ice-free extent, in the years with lowest (2003) and highest (2011) EDMS. (I) shows the domain-specific relationship between % ice-free extent and EDMS. In this plot, the Central Arctic basin (pink stippling in H) is treated separately, and its area subtracted from the other regions to calculate the regressions (the regression for the Central basin is also shown in the Inset). Empty symbols show extrapolation to 100% ice-free extent for the Atlantic, non-Atlantic, and Central domains, and shaded areas show the 95% CI of predictions.

