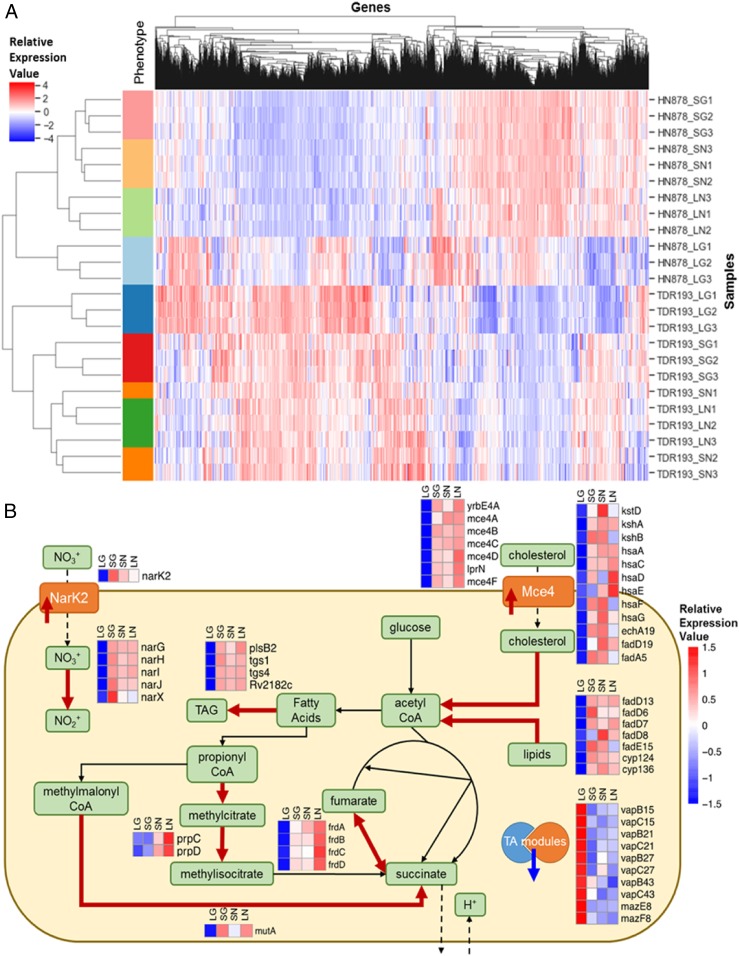
Fig. 5.
Gene-expression differences appeared between the LCs and SCs in presence and absence of glycerol. (A) Heatmap of ranked gene-expression values for the different conditions profiled by RNA sequencing. Individual samples are arrayed in the rows, and genes are arrayed along the columns. The different conditions profiled are: SG = SC in glycerol (red bars); SN = SC without glycerol (orange bars); LG = LC in glycerol (blue bars); LN = LC without glycerol (green bars). The HN878 strain background is represented in the light color bars, and the TDR193 strain background is represented in the dark color bars. Values reported are ranked RPKM values, scaled such that the mean across samples is 0 and the SD is 1. The hierarchical clustering by sample shows clear separation by condition within each strain background. The largest separation between conditions is the LG vs. the other conditions. (B) Schematic summarizing main bacterial cellular processes impacted by glpK phase variation, as implied by gene expression changes in both TDR193 and HN878 backgrounds. The heatmaps visualize the scaled means of ranked RPKM values for the corresponding genes in each condition. Thick red arrows indicate gene associated proteins or processes that would be up-regulated in SCs and in absence of glycerol, and the thick blue arrow indicates down-regulated proteins.

