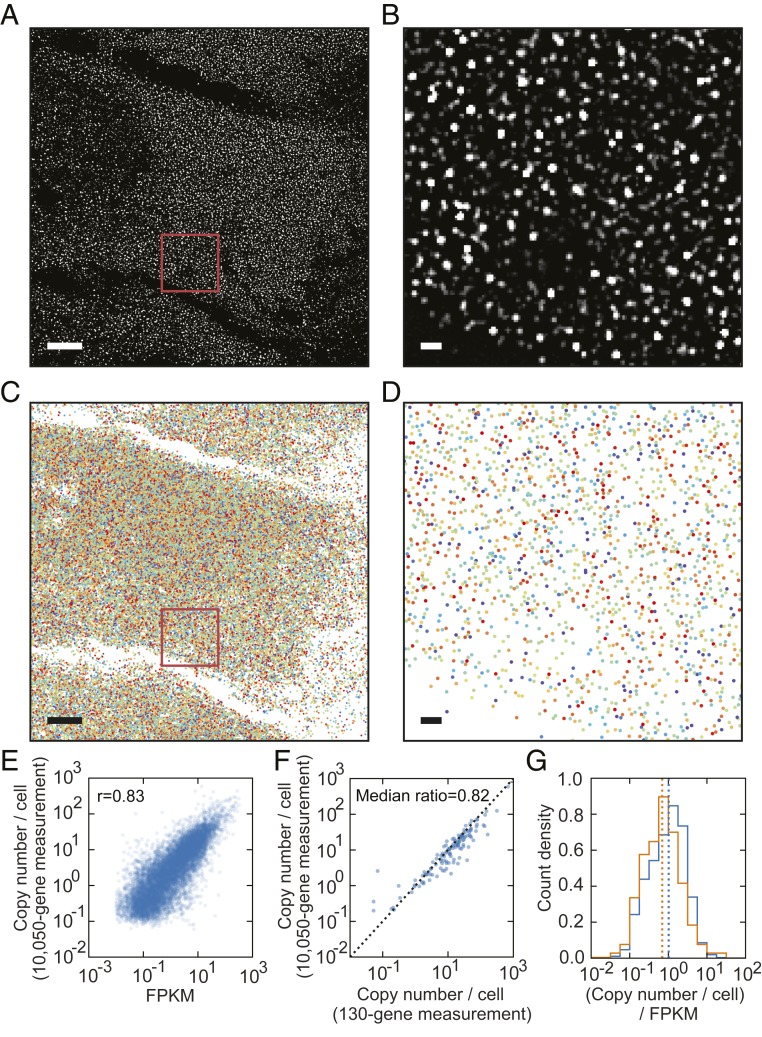
Fig. 1.
MERFISH imaging of 10,050 genes in individual U-2 OS cells. (A) A high-pass-filtered, single-z slice, single-bit image of a U-2 OS sample stained with encoding probes targeting 10,050 RNA species, imprinting a 69-bit binary barcode onto each RNA species, and with an Alexa 750-labeled readout probe that detects 1 of the 69 bits of the barcodes. (Scale bar: 10 µm.) (B) A zoomed-in image of the region marked with the red box in A. (Scale bar: 1 µm.) (C) All identified RNA molecules (colored markers) detected from all 6 imaged z slices in the region depicted in A. (Scale bar: 10 µm.) (D) A zoomed-in image of all identified RNA molecules detected from all 6 imaged z slices in the region marked with the red box in C. (Scale bar: 1 µm.) In C and D, different colored dots mark RNA molecules with distinct barcodes. (E) The copy number per cell of RNA transcripts of each gene determined by MERFISH versus the fragments per kilobase of transcript per million mapped reads determined by bulk RNA sequencing for the 10,050 measured genes. The Pearson correlation coefficient is 0.83. (F) The copy number per cell detected in the 10,050-gene measurements vs. the copy number per cell in the 130-gene measurements for the 128 genes that are commonly present in both experiments. The median value of the ratios of the 10,050-gene measurements to the 130-gene measurements for each of the 128 common genes is 0.82. (G) Normalized histograms of the FPKM-normalized copy number per cell for the 9,050 genes that were labeled using the nonoverlapping encoding-probe design (blue) and for the 1,000 genes that were labeled using the overlapping encoding-probe design (orange). The medians of the FPKM-normalized copy number per cell for the 2 groups of genes are indicated by the blue and orange dotted lines, respectively. A high-resolution version of Fig. 1 can be found on Zenodo (DOI: 10.5281/zenodo.3380442).

