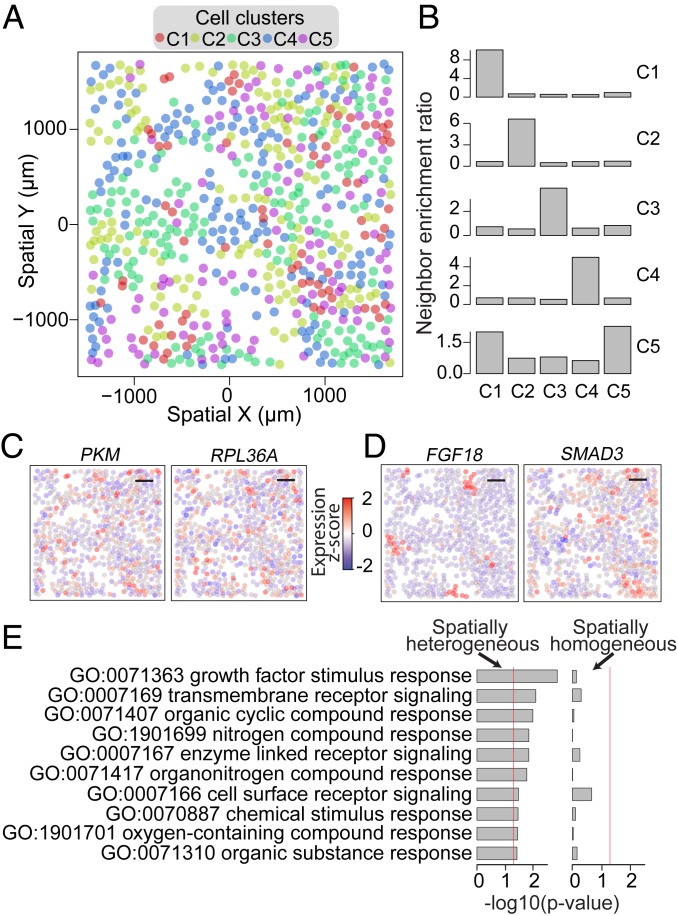
Fig. 6.
Spatial heterogeneity of transcriptionally distinct cells. (A) Centroid positions of the cells measured in 1 MERFISH replicate (points) colored by the corresponding cell’s cluster annotation. (B) Bar plots of neighbor enrichment ratios for cells assigned to each of the 5 clusters. For cells in the C1 cluster (Top), the neighbor enrichment ratio is calculated by first partitioning the cells into 2 sets: a neighbor cell set containing all cells that are within the 3 nearest neighbors of any cell in the C1 cluster and a nonneighbor cell set containing all other cells. The enrichment ratios for cells in a particular cluster (Cx, x = 1 to 5) in the neighborhood of C1 cells are defined as the ratio between the fraction of cells in the neighbor set that belong to the Cx cluster and the fraction of cells in the nonneighbor set that belong to the Cx cluster. The enrichment ratios in the neighborhood of C2, C3, C4, and C5 cells are determined similarly and shown in the 4 panels below. All clusters’ spatial neighborhood exhibits significant enrichment (Fisher’s exact P < 1e-10) for cells in the same cluster. (C and D) Spatial expression profiles for select overdispersed non-cell cycle-related genes that do not exhibit significant spatial heterogeneity in expression (Moran’s I Bonferroni-corrected P > 0.05) (C) or exhibit highly significant spatial heterogeneity in expression (Moran’s I Bonferroni-corrected P < 1e-10) (D). Each point indicates the spatial position of a cell and is colored based on the z-scored, cpm-normalized expression magnitude of PKM and RPL36A (C) and FGF18 and SMAD3 (D). (Scale bars: C and D, 500 μm.) (E) Gene set enrichment P values for a set of significantly enriched gene sets identified for genes that exhibit highly significant (Moran’s I Bonferroni-corrected P < 1e-10) spatial heterogeneity (Left) and P values of the same gene sets for genes that appear spatially homogeneous, i.e., do not exhibit significant (Moran’s I Bonferroni-corrected P > 0.05) spatial heterogeneity (Right). The red lines indicate the P = 0.05 significance threshold.

