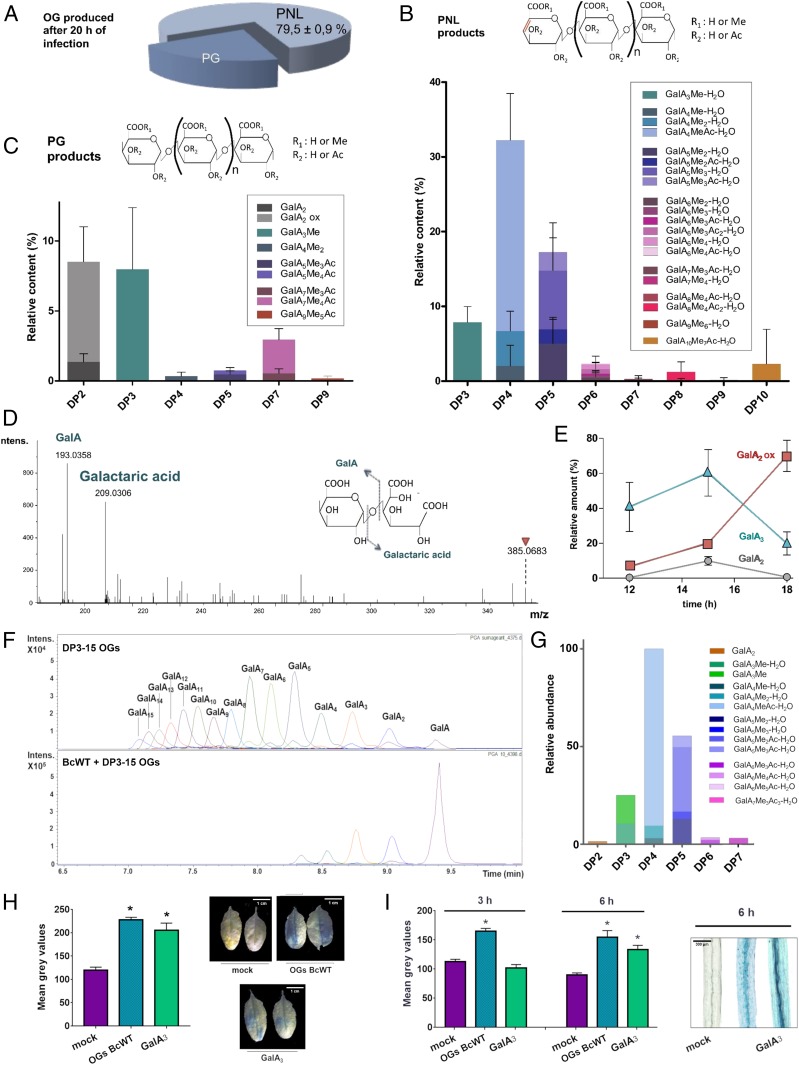
Fig. 3.
OGs released upon A. thaliana–B. cinerea interaction. (A) Proportion of pectin lyase products among total OG produced after 20-h infection of A. thaliana leaves by B. cinerea. Data are means ± SD; n = 3. (B and C) Characterization of OGs produced after 20-h infection by HP-SEC-MS. (B) PNL products; (C) PG products. Data are means ± SD; n = 3. (D) MS2 fragmentation pattern of oxydized GalA2 oligomer (m/z 385.0683) eluting at 7.8 min in Fig. 1A using HP-SEC with online MS. (E) Kinetics of GalA3, GalA2, and oxydized GalA2 upon infection. Data are means ± SD; n = 3. (F) DP10 to -15 OGs degradation by B. cinerea. OGs (2 mg/mL) were mixed with germinated B. cinerea spores and the reaction immediately stopped by addition of a volume of ethanol before analysis by HP-SEC-MS. (G) Composition of semipurified OGs from leaves infected by WT B. cinerea strain. (H) GUS quantification and staining of A. thaliana leaves expressing the promoter PGIP1::GUS fusion after the infiltration of GalA3 (200 µM) and semipurified OGs containing 5 µM of GalA4MeAc-H2O. (I) GUS quantification and staining of A. thaliana dark-grown hypocotyls expressing the promoter PGIP1::GUS fusion after the infiltration of GalA3 and semipurified OGs from leaves infected by WT B. cinerea strain. OGs are named GalAxMeyAcz. Subscript numbers indicate the degree of polymerization and the number of methyl- and acetylester groups, respectively. Asterisks directly above bars denote statistical significance compared with mock treatment (*P < 0.05).

