Fig. 4.
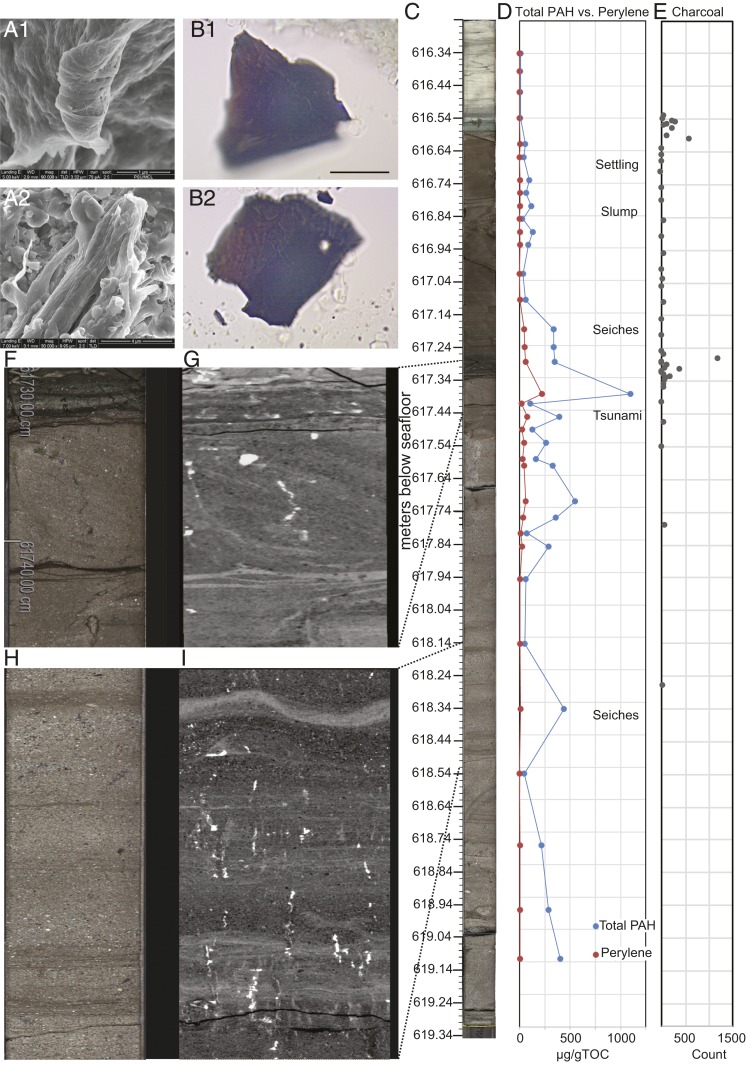
Core 40 from Site M0077 data. (A1 and A2) Scanning electron microscope images of charcoal fragments. (B1 and B2) Reflected light microscope images of charcoal fragments at 1,600× magnification. (C) Line-scan image of Core 40 showing the Transition Layer (Unit 1G) and the uppermost suevite (Unit 2A). (D) Total PAH data and the dominant PAH observed in the cross-bedded layer, perylene, both shown as micrograms per gram of total organic carbon (TOC). (E) Charcoal counts showing concentrations just above the interpreted tsunami and near the top of Unit 1G. (F) Zoomed-in view of line-scan image of the cross-bedded interval at the top of Unit 2A interpreted as being deposited by a tsunami. (G) Unwrapped CT scan of same portion of core as F. (H) Line-scan image of higher-energy deposits beneath the tsunami interpreted as seiches. (I) Unwrapped CT scan of same portion of core as H.

