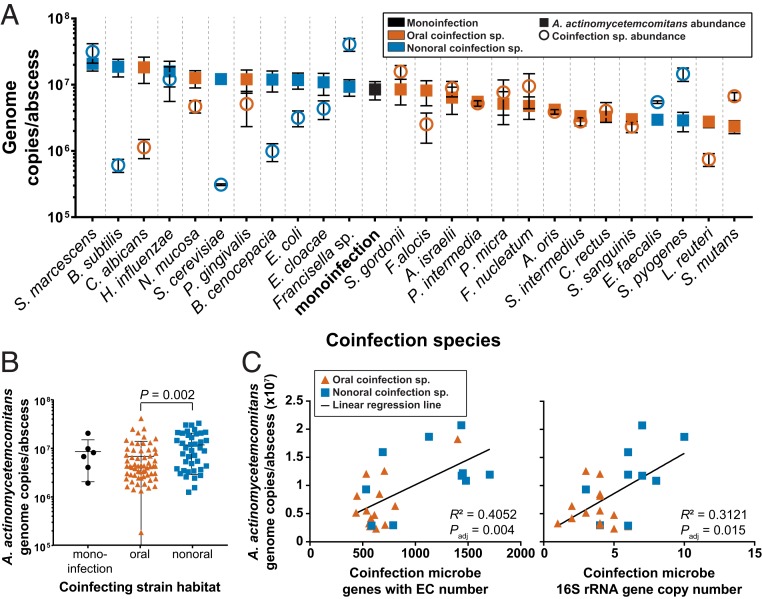
Fig. 1.
(A) Abundance of A. actinomycetemcomitans and coinfection microbes in abscesses. A. actinomycetemcomitans abundance was quantified using qPCR. The abundances of coinfection bacteria were quantified using 16S rRNA gene sequencing and normalized to A. actinomycetemcomitans abundance and 16S rRNA gene copy number. The abundances of coinfecting fungi were determined using qPCR. (B) A. actinomycetemcomitans is significantly more abundant with nonoral microbes than with oral microbes. Each point represents a single abscess. Mann–Whitney U test, P = 0.002. (C) Relationship between A. actinomycetemcomitans abundance in coinfected abscesses and genome metrics of the corresponding coinfection microbe. Linear regression best-fit line is shown with corresponding goodness of fit metric and adjusted P value, calculated using the Benjamini–Hochberg correction. See SI Appendix, Fig. S2 for additional comparisons.

