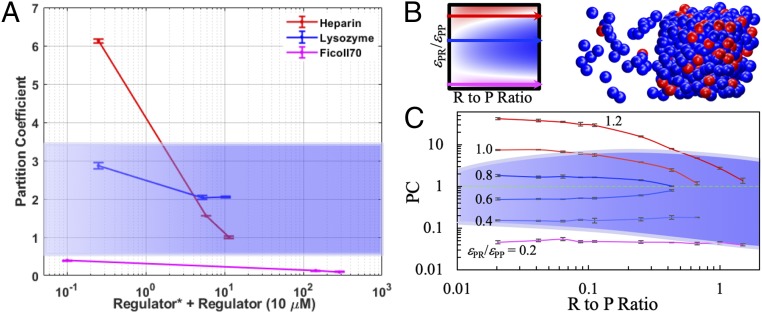
Fig. 5.
PCs of regulators in experimental and computational systems. (A) PC data for Ficoll 70, lysozyme, and heparin spanning wide ranges of regulator concentrations. Error bars reflect SDs of fluorescence intensities determined in multiple (typically a few dozens) regions of interest. The blue band covers PCs (between 0.5 and 3.5) corresponding to suppression of phase separation. Below the band are PCs corresponding to volume-exclusion promotion, and above the band are PCs corresponding to strong-attraction promotion. (B) Patchy particle models. (Left) Miniature version of Fig. 3A; (Right) illustration of partitioning of the driver (blue) and regulator (red) in the 2 phases. (C) PC results for the patchy particle models covering a full range of εPR/εPP. The curves in magenta, blue, and red represent 3 distinct classes of regulators. PC values and error bars represent averages and SDs determined from 3 replicate simulations. The blue band covers PC values that correspond to suppression of phase separation. These include the entire PC curves of weak-attraction suppressors and the tail portions of the PC curves of strong-attraction promotors.

