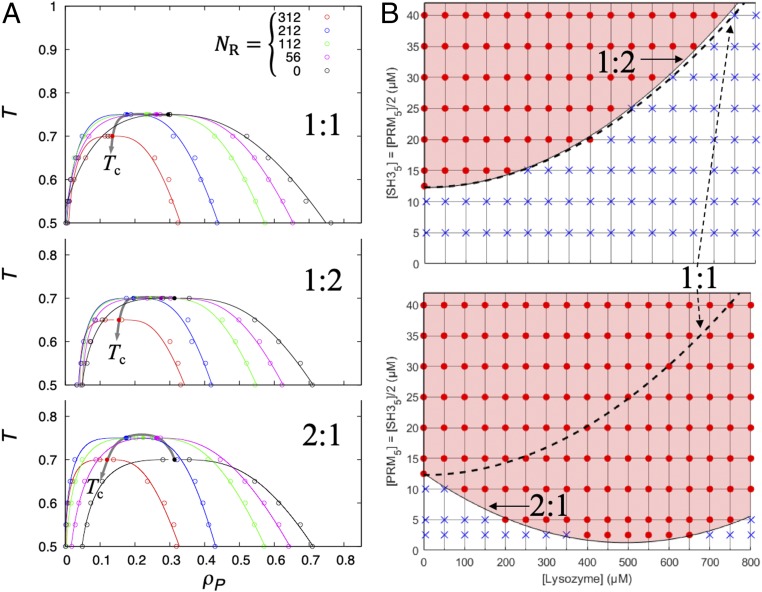
Fig. 7.
Tuning of effective strength of driver–regulator attraction by changing molar ratio between driver species. (A) Phase diagrams of patchy particle models of ternary mixtures at ε1R = 1.5 and 1:1, 1:2, and 2:1 driver–driver molar ratios. The trends of Tc (arrowed curves) at increasing particle number (NR) of the regulator indicate the regulatory effects as weak-attraction suppression for 1:1 and 1:2 mixing but strong-attraction promotion for 2:1 mixing. (B) Phase boundaries of SH35–PRM5–lysozyme mixtures confirming the computational prediction.

