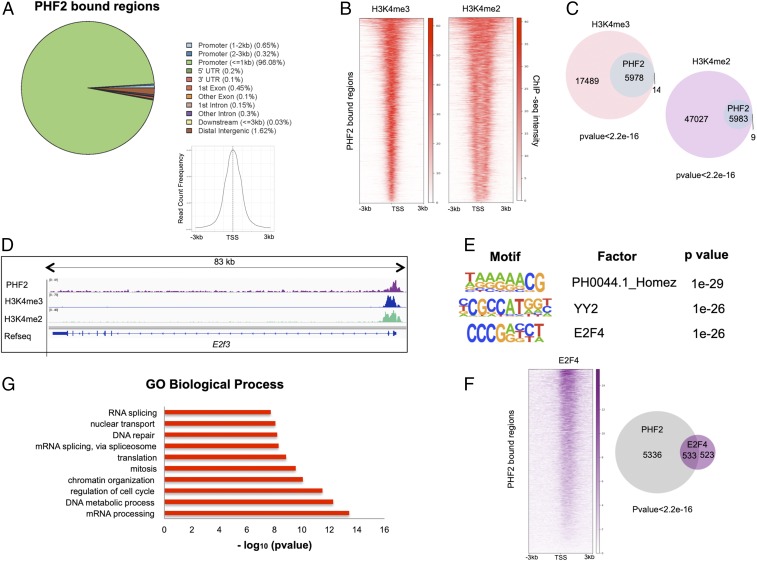
Fig. 1.
PHF2 binds promoters in NSCs. (A) Genomic distribution of PHF2 ChIP-seq peaks in NSCs showing that PHF2 mainly binds promoter regions around the TSS. (B) Heatmaps depicting PHF2 binding to H3K4me3- and H3K4me2-marked promoters in NSCs 3 kb around the TSS. Scales indicate ChIP-seq intensities. (C) Venn diagrams showing overlap between PHF2-bound and H3K4me3 and H3K4me2-marked regions. P value is the result of an equal proportions test performed between H3K4me3 and H3K4me2 peaks and a random set. (D) IGV capture showing PHF2, H3K4me3, and H3K4me2 peaks in E2f3 gene in NSCs. (E) Motif enrichment analysis of PHF2 ChIP-seq peaks in NSCs using the Homer de novo motif research tool showing the 3 top enriched motifs. (F) Heatmap representation of PHF2 and E2F4 co-occupied regions (Left) and Venn diagrams (Right) showing peak overlapping between PHF2-bound and E2F4-bound regions in published ChIP-seq in HeLa S3 cells. (G) Gene ontology analysis showing the biological process of the PHF2-bound genes was performed using as a background the whole Mus musculus genome.

