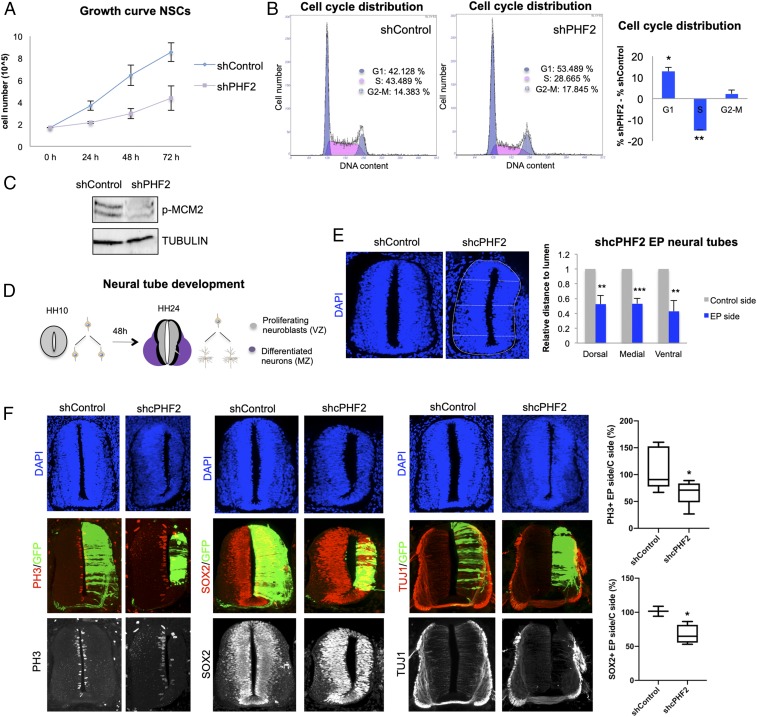
Fig. 4.
PHF2 depletion blocks neurogenesis in the spinal cord. (A) Growth curve showing the proliferation rate of NSCs infected with lentivirus expressing shRNA control (shControl) or shRNA for PHF2 (shPHF2) from 0 to 72 h. (B) Flow cytometry analysis of NSCs control and PHF2-depleted cells previously stained with propidium iodide. (C) Total protein extracts were prepared from NSCs infected with lentivirus expressing shRNA control (shControl) or shRNA specific for PHF2 (shPHF2) and the phospho-MCM2 (p-MCM2) and TUBULIN levels were determined by immunoblot. (D) Schematic representation indicating the regions occupied by proliferating neural progenitors (VZ) and postmitotic neurons (MZ) in HH10 and HH24 chicken embryo spinal cord. (E) HH10–12 embryos were electroporated with shControl or shRNA for cPHF2 (shcPHF2) cloned into pSUPER vector and GFP-expressing vector. Transversal sections of electroporated neural tubes are indicated above stained with DAPI 48 h postelectroporation (PE). Graphs show the quantification of the size of the control side and shcPHF2-electroporated side. To do so, we measured the dorsal, medial, and ventral distances to the lumen on each side, relative to the length of the central line of the lumen. Data represent the mean of 4 to 5 embryos (from 2 to 4 biological independent experiments). Error bars indicate SD **P < 0.01; ***P < 0.001 (Student’s t test). (F) Transversal sections of neural tubes from HH10–12 embryos electroporated in ovo with shControl or shcPHF2 and stained for H3S10P (PH3), Sox2, or TUJ1 48 PE. Boxplots are showing the quantification of the corresponding immunostaining. Data represent the mean of 4 to 12 embryos (from 3 to 4 biological independent experiments). *P < 0.05 (Student’s t test).

