Fig. 5.
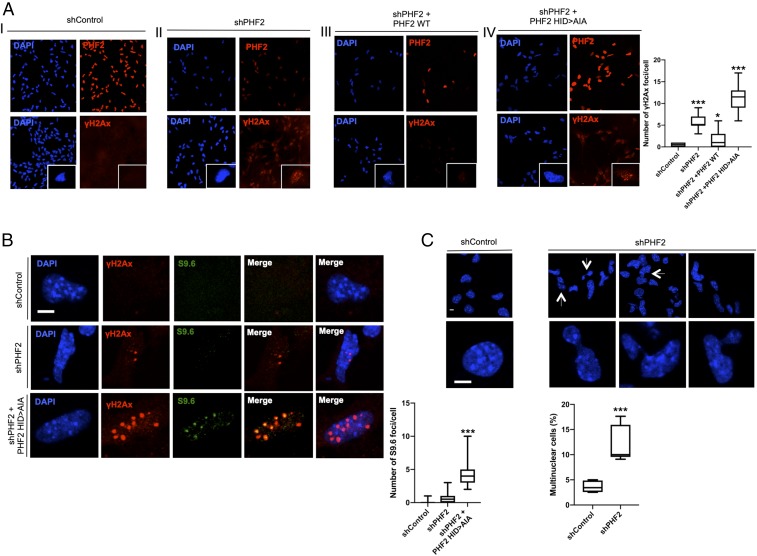
PHF2 depletion leads to DNA damage and genome instability. (A) Immunostaining of NSCs expressing shControl (I), shPHF2 (II), shPHF2 together with PHF2 WT (III), and shPHF2 together with PHF2 (249H > A) (IV). Cells were fixed and stained with PHF2 and γH2Ax antibodies and DAPI. Enlarged images are showing individual cells. More than 30 cells were quantified. Data shown are representative of 2 to 3 biological independent experiments (Scale bar: 20 μm.) Boxplots represent the number of γH2Ax foci/cell. *P < 0.05; ***P < 0.001 (Student’s t test). (B) Immunostaining of a representative enlarged cell expressing shControl, shPHF2, and shPHF2 together with PHF2 (249H > A). Cells were fixed and stained with γH2Ax and S9.6 antibodies and DAPI. More than 30 cells were quantified. Data shown are representative of 2 to 3 biological independent experiments (Scale bar: 5 μm.) Boxplots represent the number of S9.6 foci/cell. ***P < 0.001 (Student’s t test). (C) Formation of multinucleated cells and segregation defects are shown for shControl and shPHF2 cells. A total of 50 to 100 cells were quantified. Data shown are representative of 4 independent experiments (Scale bar: 5 μm.) Boxplots represent the percentage of multinuclear cells. ***P < 0.001 (Student’s t test).

