Fig. 1.
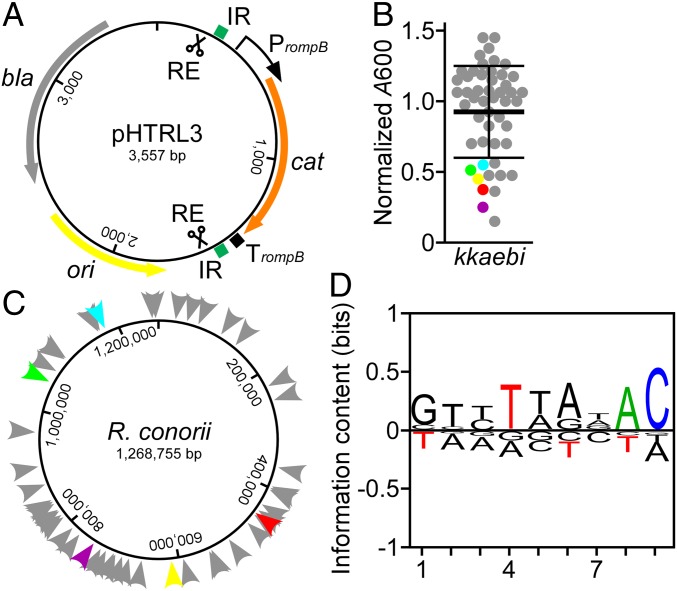
Transposon mutagenesis in R. conorii. (A) Map of pHTRL3 with the kkaebi minitransposon. (B) A600 was measured to determine the yield of R. conorii kkaebi variants after 4 d growth on Vero cells. Five variants (HK2, HK24, HK27, HK28, and HK50) with defective growth are colored in red, yellow, green, purple, and light blue, respectively. (C) Diagram illustrating the position of kkaebi insertion sites on the R. conorii chromosome (color code same as in B). (D) BLogo sequence logo plot generated with 53 insertion events of kkaebi. Nine bases were used to generate the sequence logo. Nucleotide frequency at each position is indicated by the relative height of each letter; significantly increased or reduced frequency (P < 0.05) at a given position is shown in color.

