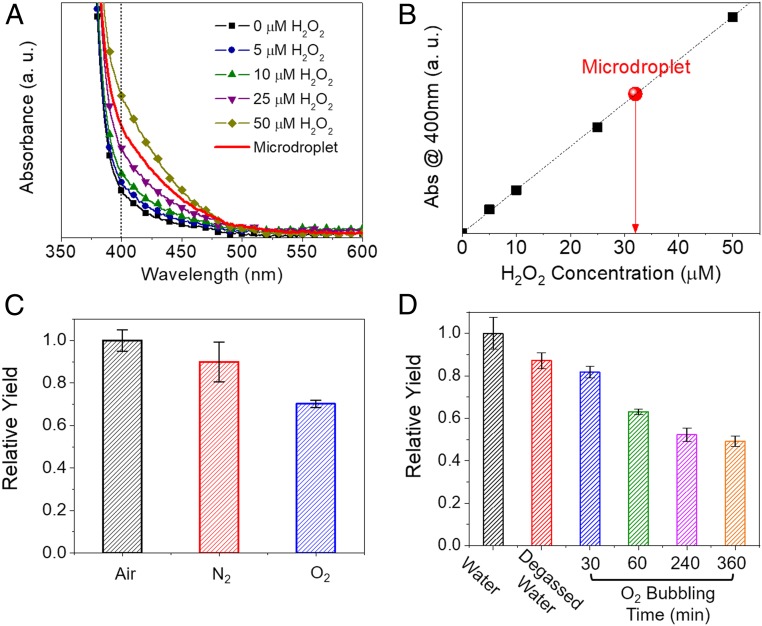
Fig. 4.
H2O2 concentration as a function of different operating conditions. (A) Absorption spectrum of aqueous PTO solution with added H2O2. Example microdroplet spectrum in red. (B) Calibration curve at 400 nm from A. The red circle represents the concentration of H2O2 generated from aqueous microdroplets acquired from the spectra in A. (C) The effect of varying the nebulizing gas. (D) The effect of dissolving different gases in water. Both C and D are measured with peroxide test strips. Error bars represent 1 SD from 3 measurements.

